\n
## Line Chart: Performance Comparison of Problem Solving Methods
### Overview
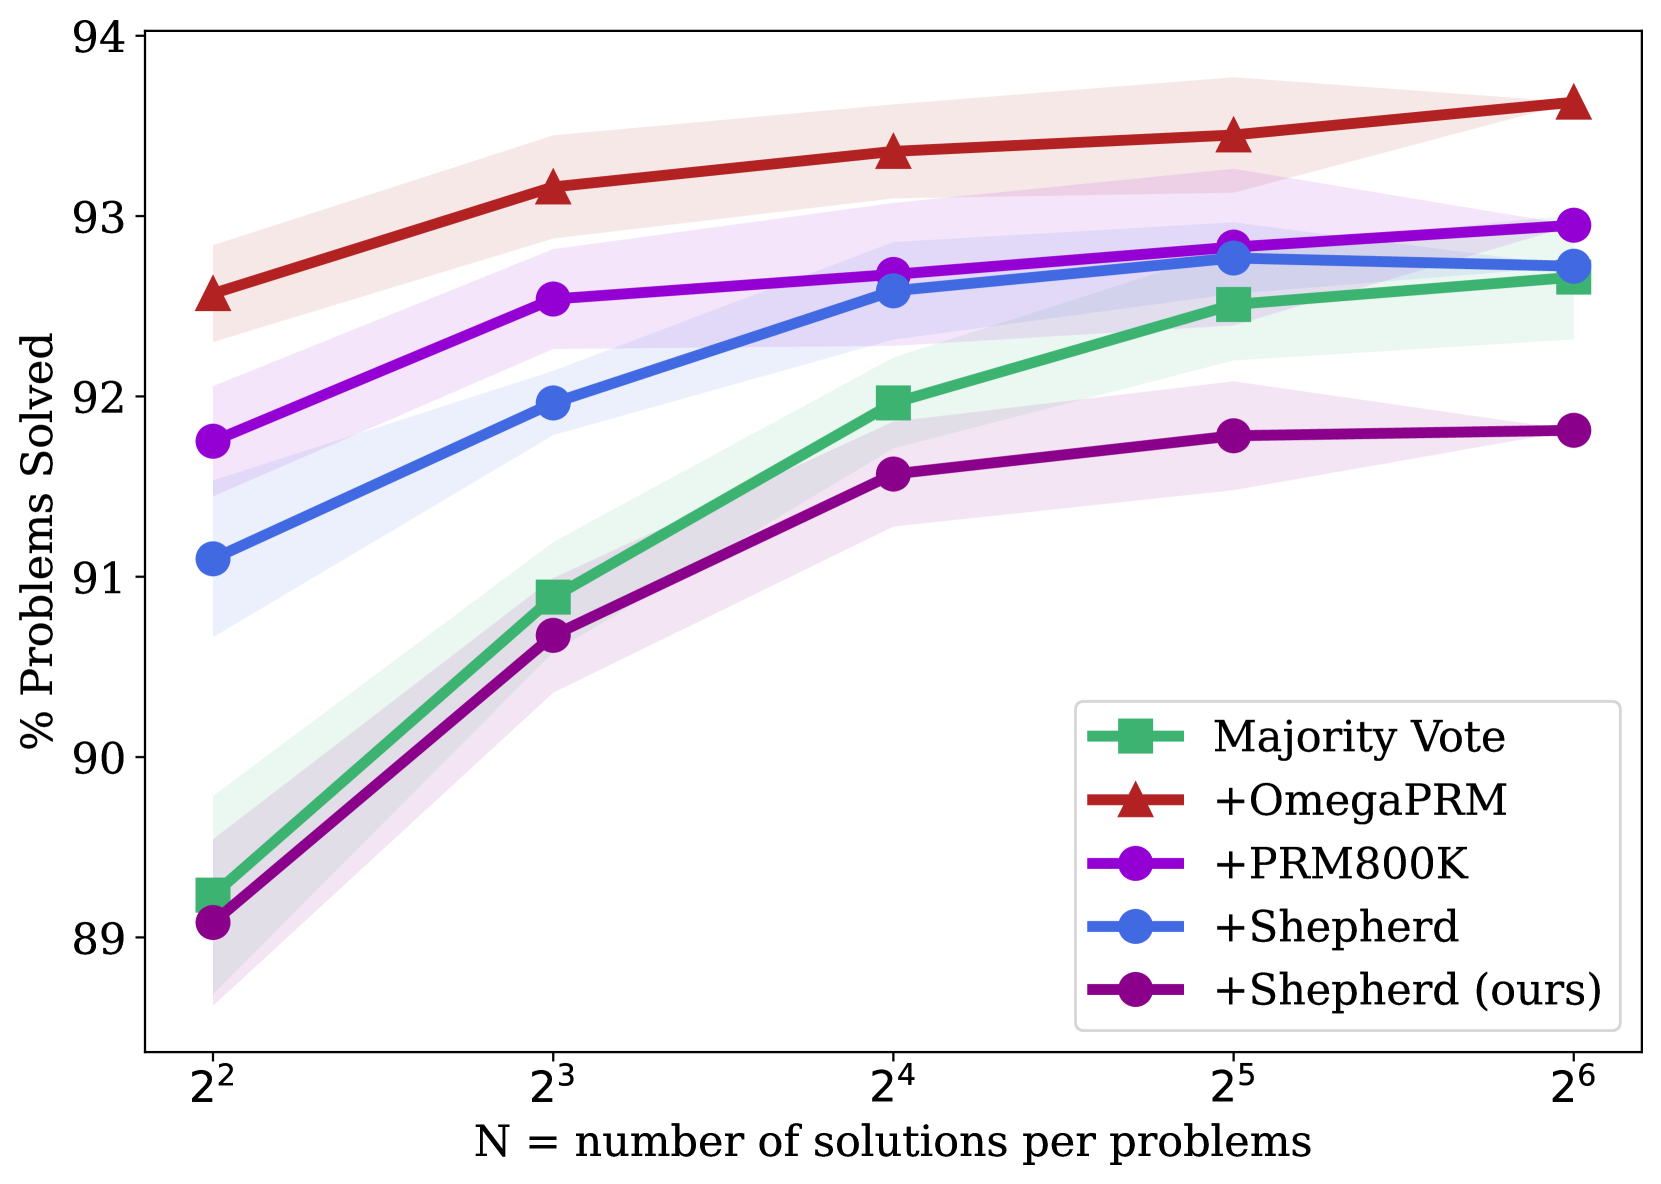
This line chart compares the performance of several problem-solving methods as a function of the number of solutions generated per problem. The y-axis represents the percentage of problems solved, while the x-axis represents the number of solutions (N) per problem, expressed as powers of 2. The chart displays five different methods: Majority Vote, +OmegaPRM, +PRM800K, +Shepherd, and +Shepherd (ours).
### Components/Axes
* **Y-axis Title:** "% Problems Solved"
* Scale: Ranges from approximately 88% to 94%.
* Markers: 88, 89, 90, 91, 92, 93, 94
* **X-axis Title:** "N = number of solutions per problems"
* Scale: Logarithmic, with markers at 2<sup>2</sup>, 2<sup>3</sup>, 2<sup>4</sup>, 2<sup>5</sup>, 2<sup>6</sup> (which are approximately 4, 8, 16, 32, 64).
* **Legend:** Located in the bottom-right corner of the chart.
* Majority Vote (Green)
* +OmegaPRM (Red)
* +PRM800K (Magenta)
* +Shepherd (Light Blue)
* +Shepherd (ours) (Purple)
### Detailed Analysis
Here's a breakdown of each line's trend and approximate data points, verified against the legend colors:
* **Majority Vote (Green):** The line slopes upward, starting at approximately 88.5% at N=4 and reaching approximately 92.5% at N=64.
* N=4: ~88.5%
* N=8: ~89.5%
* N=16: ~91.5%
* N=32: ~92.0%
* N=64: ~92.5%
* **+OmegaPRM (Red):** This line shows a consistently high performance, with a slight upward slope. It starts at approximately 92.8% at N=4 and reaches approximately 93.8% at N=64.
* N=4: ~92.8%
* N=8: ~93.0%
* N=16: ~93.2%
* N=32: ~93.4%
* N=64: ~93.8%
* **+PRM800K (Magenta):** The line is relatively flat, with a slight increase. It begins at approximately 91.8% at N=4 and reaches approximately 92.8% at N=64.
* N=4: ~91.8%
* N=8: ~92.2%
* N=16: ~92.4%
* N=32: ~92.6%
* N=64: ~92.8%
* **+Shepherd (Light Blue):** This line shows a moderate upward slope, starting at approximately 92.2% at N=4 and reaching approximately 92.8% at N=64.
* N=4: ~92.2%
* N=8: ~92.5%
* N=16: ~92.6%
* N=32: ~92.7%
* N=64: ~92.8%
* **+Shepherd (ours) (Purple):** This line starts at approximately 89.2% at N=4 and increases to approximately 91.5% at N=64.
* N=4: ~89.2%
* N=8: ~90.2%
* N=16: ~90.8%
* N=32: ~91.2%
* N=64: ~91.5%
### Key Observations
* +OmegaPRM consistently outperforms all other methods across all values of N.
* Majority Vote and +Shepherd (ours) start with the lowest performance, but show improvement as N increases.
* +PRM800K and +Shepherd exhibit relatively stable performance with minimal improvement as N increases.
* The performance gap between +OmegaPRM and other methods widens slightly as N increases.
### Interpretation
The data suggests that increasing the number of solutions generated per problem (N) generally improves the performance of the problem-solving methods, although the extent of improvement varies. +OmegaPRM appears to be the most effective method, consistently achieving the highest percentage of problems solved. The "ours" version of +Shepherd starts with lower performance but shows a positive trend, indicating potential for improvement with further optimization. The relatively flat performance of +PRM800K and +Shepherd suggests that they may reach a performance plateau with increasing N. The chart demonstrates a trade-off between computational cost (generating more solutions) and solution accuracy (percentage of problems solved). The logarithmic scale on the x-axis highlights the diminishing returns of generating more solutions beyond a certain point. The data implies that for maximizing problem-solving success, +OmegaPRM is the preferred method, but other methods can be viable depending on computational constraints and desired performance levels.