# Technical Document Extraction: Graph Process Diagram
## Diagram Overview
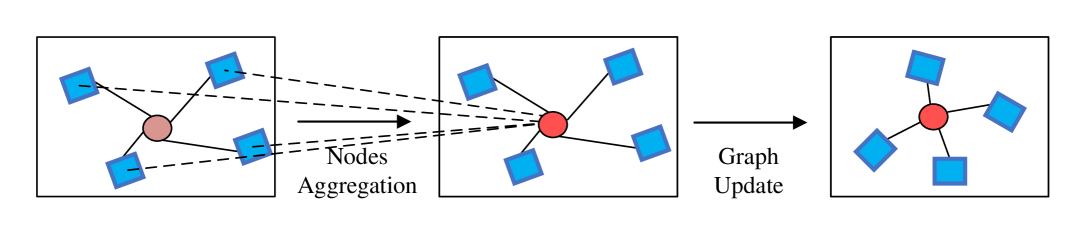
The image depicts a three-stage graph processing workflow involving node aggregation and graph updates. The diagram uses color-coded nodes (red central node, blue peripheral nodes) and directional arrows to illustrate data flow.
---
## Component Analysis
### Stage 1: Nodes Aggregation
- **Visual Elements**:
- Central red node (aggregation target)
- Four blue nodes (source nodes)
- Dashed arrows from blue nodes to red node (aggregation paths)
- **Labels**:
- "Nodes Aggregation" (arrow label between stages 1→2)
- **Spatial Grounding**:
- Coordinates: [x=150, y=200] to [x=450, y=200] (approximate center of aggregation arrows)
### Stage 2: Graph Update
- **Visual Elements**:
- Red node now directly connected to four blue nodes via solid lines
- Dashed aggregation arrows replaced by direct connections
- **Labels**:
- "Graph Update" (arrow label between stages 2→3)
- **Spatial Grounding**:
- Coordinates: [x=550, y=200] to [x=850, y=200] (approximate center of update arrows)
### Stage 3: Final Graph State
- **Visual Elements**:
- Simplified graph with red node connected to four blue nodes
- No aggregation paths visible
- **Labels**:
- No explicit label, but implied final state
---
## Process Flow
1. **Aggregation Phase**:
- Blue nodes contribute data to central red node via dashed arrows
- Represents feature aggregation from neighboring nodes
2. **Update Phase**:
- Dashed aggregation arrows transform into solid connections
- Indicates graph structure modification based on aggregated data
3. **Final State**:
- Simplified graph structure with direct node connections
- Suggests completion of graph update operation
---
## Technical Interpretation
- **Node Representation**:
- Red node: Central processing unit/aggregation hub
- Blue nodes: Peripheral data sources/features
- **Arrow Semantics**:
- Dashed arrows: Temporary data flow during aggregation
- Solid arrows: Permanent graph structure after update
- **Workflow Implication**:
- Graph neural network message passing mechanism
- Node feature aggregation followed by structural update
---
## Language Analysis
- **Primary Language**: English (all labels and annotations)
- **No secondary languages detected**
---
## Diagram Metadata
- **Diagram Type**: Process flowchart
- **Color Scheme**:
- Red: Central aggregation node
- Blue: Peripheral data nodes
- Black: Arrows and text
- **Layout**:
- Horizontal progression from left to right
- Equal vertical alignment of all stages
---
## Missing Elements
- No numerical data or quantitative values present
- No explicit time stamps or iteration counters
- No explicit node feature values or aggregation functions specified
---
## Conclusion
This diagram illustrates a fundamental graph processing operation where peripheral node data is aggregated into a central node, followed by a structural graph update. The process resembles message passing in graph neural networks, with clear visual distinction between temporary aggregation paths and permanent graph connections.