\n
## Bar Chart: Prediction Flip Rate for Llama-3 Models
### Overview
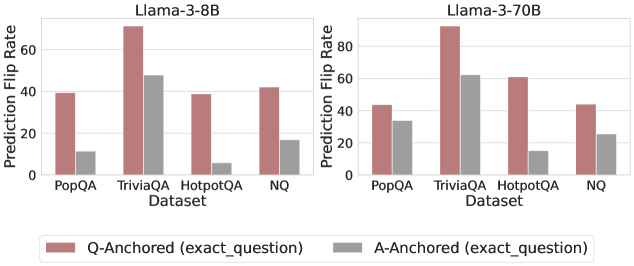
The image presents a comparative bar chart illustrating the prediction flip rate for two Llama-3 models (8B and 70B) across four different datasets: PopQA, TriviaQA, HotpotQA, and NQ. The flip rate is measured as a percentage and is shown for both "Q-Anchored" (exact question) and "A-Anchored" (exact question) scenarios.
### Components/Axes
* **X-axis:** Dataset (PopQA, TriviaQA, HotpotQA, NQ)
* **Y-axis:** Prediction Flip Rate (ranging from 0 to 60, with increments of 10)
* **Models:** Two separate charts, one for Llama-3-8B and one for Llama-3-70B.
* **Legend:**
* Red: Q-Anchored (exact\_question)
* Gray: A-Anchored (exact\_question)
### Detailed Analysis
**Llama-3-8B Chart:**
* **PopQA:** Q-Anchored is approximately 42%, A-Anchored is approximately 8%.
* **TriviaQA:** Q-Anchored is approximately 58%, A-Anchored is approximately 48%.
* **HotpotQA:** Q-Anchored is approximately 42%, A-Anchored is approximately 10%.
* **NQ:** Q-Anchored is approximately 42%, A-Anchored is approximately 16%.
**Llama-3-70B Chart:**
* **PopQA:** Q-Anchored is approximately 42%, A-Anchored is approximately 42%.
* **TriviaQA:** Q-Anchored is approximately 56%, A-Anchored is approximately 48%.
* **HotpotQA:** Q-Anchored is approximately 48%, A-Anchored is approximately 12%.
* **NQ:** Q-Anchored is approximately 42%, A-Anchored is approximately 16%.
**Trends:**
* In both models, the Q-Anchored flip rate is generally higher than the A-Anchored flip rate for all datasets.
* TriviaQA consistently shows the highest Q-Anchored flip rate for both models.
* HotpotQA consistently shows the lowest A-Anchored flip rate for both models.
* The 70B model shows a more consistent A-Anchored flip rate across datasets compared to the 8B model.
### Key Observations
* The difference between Q-Anchored and A-Anchored flip rates is most pronounced in the 8B model, particularly for TriviaQA and HotpotQA.
* The 70B model exhibits a more balanced flip rate between Q-Anchored and A-Anchored scenarios.
* The 70B model shows a slight increase in Q-Anchored flip rate for HotpotQA compared to the 8B model.
### Interpretation
The data suggests that the Llama-3 models exhibit a tendency to "flip" their predictions when prompted with the question directly (Q-Anchored) versus when prompted with the answer (A-Anchored). This difference in flip rate may indicate sensitivity to the phrasing of the prompt or a potential bias in the model's training data. The higher flip rates observed in TriviaQA could be due to the complexity or ambiguity of the questions in that dataset. The 70B model's more consistent performance across datasets suggests that increasing model size may improve robustness and reduce sensitivity to prompt variations. The fact that the A-Anchored flip rates are generally lower suggests that providing the answer as context can help stabilize the model's predictions. This could be useful in applications where consistency and reliability are critical. The difference in flip rates between the two models suggests that the larger model (70B) is less susceptible to prompt engineering or adversarial attacks.