## Grouped Bar Chart: Prediction Flip Rate by Dataset and Anchoring Method
### Overview
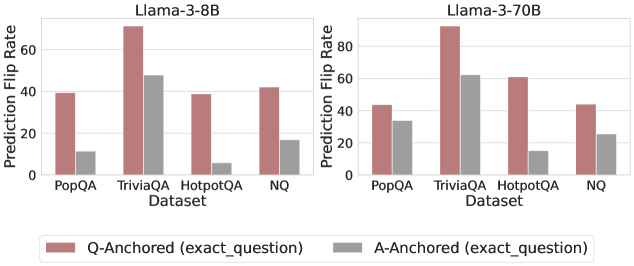
The image displays two side-by-side grouped bar charts comparing the "Prediction Flip Rate" of two language models (Llama-3-8B and Llama-3-70B) across four question-answering datasets. The charts evaluate the effect of two different anchoring methods ("Q-Anchored" and "A-Anchored") on model prediction stability.
### Components/Axes
* **Chart Titles:** "Llama-3-8B" (left chart), "Llama-3-70B" (right chart).
* **Y-Axis (Both Charts):** Labeled "Prediction Flip Rate". The scale runs from 0 to 80, with major tick marks at intervals of 20 (0, 20, 40, 60, 80).
* **X-Axis (Both Charts):** Labeled "Dataset". Four categorical datasets are listed: "PopQA", "TriviaQA", "HotpotQA", "NQ".
* **Legend:** Positioned at the bottom center of the entire image, spanning both charts.
* **Reddish-brown bar:** "Q-Anchored (exact_question)"
* **Gray bar:** "A-Anchored (exact_question)"
### Detailed Analysis
**Llama-3-8B Chart (Left):**
* **PopQA:** Q-Anchored bar is at approximately 40. A-Anchored bar is significantly lower, at approximately 10.
* **TriviaQA:** Q-Anchored bar is the highest in this chart, at approximately 70. A-Anchored bar is at approximately 48.
* **HotpotQA:** Q-Anchored bar is at approximately 39. A-Anchored bar is the lowest in the chart, at approximately 5.
* **NQ:** Q-Anchored bar is at approximately 42. A-Anchored bar is at approximately 18.
**Llama-3-70B Chart (Right):**
* **PopQA:** Q-Anchored bar is at approximately 44. A-Anchored bar is at approximately 34.
* **TriviaQA:** Q-Anchored bar is the highest in the entire image, at approximately 90. A-Anchored bar is at approximately 62.
* **HotpotQA:** Q-Anchored bar is at approximately 61. A-Anchored bar is at approximately 16.
* **NQ:** Q-Anchored bar is at approximately 45. A-Anchored bar is at approximately 26.
**Trend Verification:**
* In both charts, for every dataset, the **Q-Anchored (reddish-brown) bar is taller than the A-Anchored (gray) bar**. This visual trend is consistent.
* The **TriviaQA dataset** consistently shows the highest flip rates for both anchoring methods in both models.
* The **HotpotQA dataset** shows the most dramatic relative difference between anchoring methods, especially in the 8B model where the A-Anchored rate is very low.
### Key Observations
1. **Consistent Anchoring Effect:** The "Q-Anchored" method consistently results in a higher Prediction Flip Rate than the "A-Anchored" method across all datasets and both model sizes.
2. **Model Size Impact:** The larger Llama-3-70B model exhibits higher flip rates overall compared to the Llama-3-8B model for the same datasets and anchoring methods.
3. **Dataset Sensitivity:** The "TriviaQA" dataset appears to be the most sensitive to anchoring, producing the highest flip rates. "HotpotQA" shows the largest disparity between the two anchoring methods.
4. **Spatial Layout:** The charts are placed side-by-side for direct comparison. The shared legend at the bottom applies to both, ensuring consistent color coding.
### Interpretation
This data suggests that the method of anchoring context (providing the exact question vs. the exact answer) significantly influences the stability of a language model's predictions. The consistently higher flip rates for "Q-Anchored" indicate that when the model is primed with the exact question, its final answer is more likely to change compared to when it is primed with the exact answer. This could imply that the model's reasoning path is more malleable or sensitive when focused on the question formulation.
The increased flip rates in the larger 70B model might suggest that greater model capacity leads to a higher sensitivity to contextual anchoring, potentially incorporating the anchor more deeply into its reasoning process. The outlier behavior of "HotpotQA," where A-Anchored flip rates are particularly low, may indicate that for multi-hop reasoning tasks (which HotpotQA often involves), being anchored with the answer provides a much stronger, more stabilizing signal to the model than being anchored with the question alone. Overall, the chart demonstrates that prediction stability is not a fixed property of a model but is contingent on both the task (dataset) and the specific prompting strategy (anchoring method) employed.