## Bar Chart: Prediction Flip Rate Comparison for Llama-3-8B and Llama-3-70B Models
### Overview
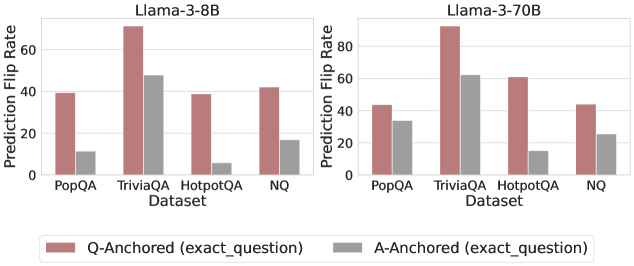
The image contains two side-by-side bar charts comparing prediction flip rates for two language models (Llama-3-8B and Llama-3-70B) across four question-answering datasets (PopQA, TriviaQA, HotpotQA, NQ). Each model is evaluated using two anchoring methods: Q-Anchored (exact_question) and A-Anchored (exact_question), represented by distinct colors (red for Q-Anchored, gray for A-Anchored).
### Components/Axes
- **X-Axis (Datasets)**: PopQA, TriviaQA, HotpotQA, NQ (categorical, evenly spaced).
- **Y-Axis (Prediction Flip Rate)**: Percentage scale from 0 to 80 (linear, increments of 20).
- **Legend**: Located at the bottom center, with red bars labeled "Q-Anchored (exact_question)" and gray bars labeled "A-Anchored (exact_question)".
- **Model Labels**: "Llama-3-8B" (top-left chart) and "Llama-3-70B" (top-right chart).
### Detailed Analysis
#### Llama-3-8B Model
- **Q-Anchored (red)**:
- PopQA: ~40%
- TriviaQA: ~70% (highest value)
- HotpotQA: ~40%
- NQ: ~45%
- **A-Anchored (gray)**:
- PopQA: ~10%
- TriviaQA: ~50%
- HotpotQA: ~5% (lowest value)
- NQ: ~15%
#### Llama-3-70B Model
- **Q-Anchored (red)**:
- PopQA: ~40%
- TriviaQA: ~90% (highest value)
- HotpotQA: ~60%
- NQ: ~40%
- **A-Anchored (gray)**:
- PopQA: ~30%
- TriviaQA: ~65%
- HotpotQA: ~15%
- NQ: ~25%
### Key Observations
1. **Q-Anchored vs. A-Anchored**: Q-Anchored consistently shows higher prediction flip rates than A-Anchored for both models across all datasets.
2. **Model Size Impact**: Llama-3-70B outperforms Llama-3-8B in Q-Anchored rates (e.g., TriviaQA: 90% vs. 70%), but the gap narrows in A-Anchored (65% vs. 50%).
3. **Dataset Variability**: TriviaQA exhibits the highest flip rates for both models, while HotpotQA has the lowest A-Anchored rates.
4. **NQ Dataset**: Shows moderate performance, with Llama-3-70B achieving ~40% (Q-Anchored) vs. ~25% (A-Anchored).
### Interpretation
The data suggests that **Q-Anchored questions** (exact_question) induce higher prediction flip rates, likely due to stricter alignment with ground-truth answers, increasing uncertainty. The larger Llama-3-70B model demonstrates superior performance in Q-Anchored settings, particularly in complex datasets like TriviaQA. However, A-Anchored rates remain lower across all cases, indicating that answer anchoring reduces variability but also limits model exploration. The consistent trend across model sizes implies that anchoring method has a more significant impact on flip rates than model capacity alone. TriviaQA’s high flip rates highlight its role as a challenging benchmark for factual reasoning.