## Line Charts: Gradient Updates vs. Dimension
### Overview
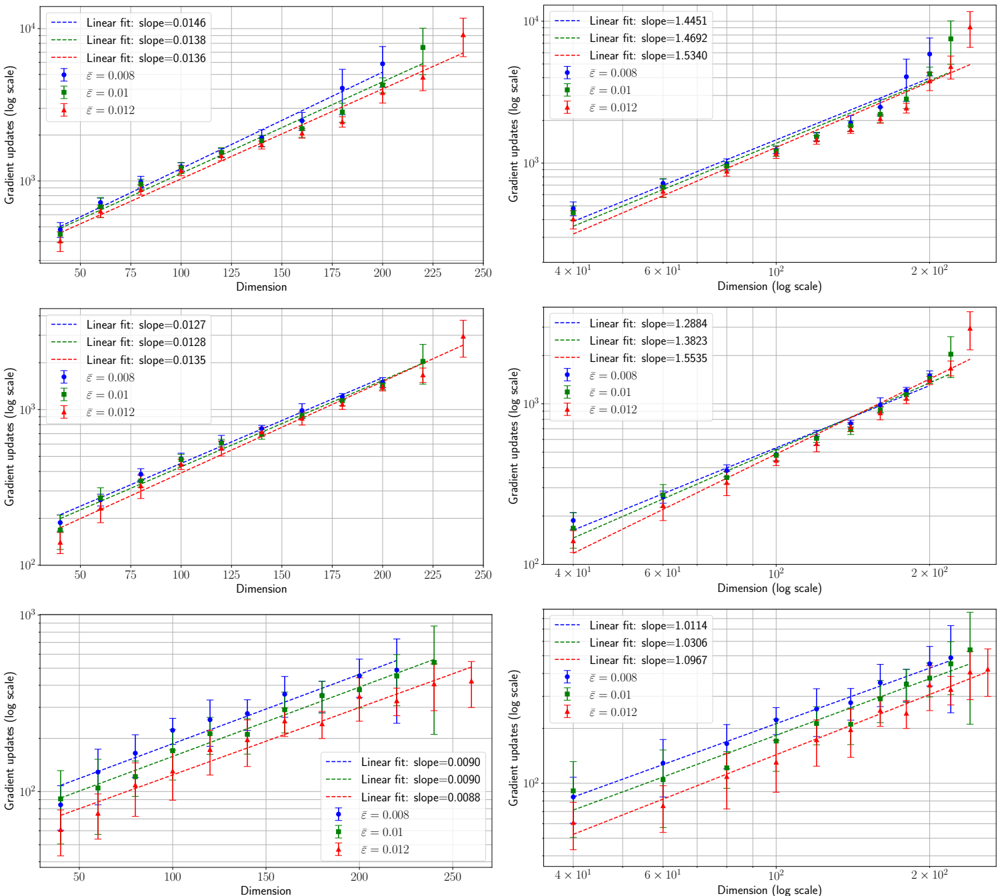
The image contains six line charts arranged in two columns (linear and log-scale x-axis) and three rows (different slope ranges). Each chart visualizes the relationship between **dimension** (x-axis) and **gradient updates** (y-axis, log scale), with linear fits and data points for three epsilon values (ε = 0.008, 0.01, 0.012). The charts demonstrate consistent upward trends, with slopes varying across subplots.
---
### Components/Axes
- **X-axis**:
- Left column: Linear scale (50–250).
- Right column: Log scale (4×10¹–2×10²).
- **Y-axis**: "Gradient updates (log scale)" across all charts.
- **Legends**:
- Positioned in the top-left of each chart.
- Three lines per chart:
- **Blue (dashed)**: Linear fit with slope (e.g., 0.0146).
- **Green (dotted)**: Linear fit with slope (e.g., 0.0138).
- **Red (dash-dot)**: Linear fit with slope (e.g., 0.0136).
- Three data point markers:
- **Blue circles**: ε = 0.008.
- **Green squares**: ε = 0.01.
- **Red triangles**: ε = 0.012.
---
### Detailed Analysis
#### Top-Left Chart (Linear X-axis, Slope ~0.014)
- **Slope Values**:
- Blue: 0.0146
- Green: 0.0138
- Red: 0.0136
- **Data Points**:
- ε = 0.008 (blue): Gradient updates increase from ~10³ to ~10⁴ as dimension rises from 50 to 250.
- ε = 0.01 (green): Similar trend, slightly lower than blue.
- ε = 0.012 (red): Slightly lower than green, with larger error bars.
- **Trend**: All lines slope upward, with blue (ε = 0.008) consistently highest.
#### Top-Right Chart (Log X-axis, Slope ~1.4–1.5)
- **Slope Values**:
- Blue: 1.4451
- Green: 1.4692
- Red: 1.5340
- **Data Points**:
- ε = 0.008 (blue): Gradient updates rise from ~10³ to ~10⁴ as dimension increases from 40 to 200.
- ε = 0.01 (green): Slightly higher than blue.
- ε = 0.012 (red): Highest slope, with larger error bars.
- **Trend**: Lines converge at lower dimensions but diverge at higher dimensions.
#### Middle-Left Chart (Linear X-axis, Slope ~0.012–0.013)
- **Slope Values**:
- Blue: 0.0127
- Green: 0.0128
- Red: 0.0135
- **Data Points**:
- ε = 0.008 (blue): Gradient updates increase from ~10³ to ~10⁴ as dimension rises from 50 to 250.
- ε = 0.01 (green): Slightly higher than blue.
- ε = 0.012 (red): Highest slope, with larger error bars.
- **Trend**: Lines are nearly parallel, with red (ε = 0.012) slightly steeper.
#### Middle-Right Chart (Log X-axis, Slope ~1.2–1.5)
- **Slope Values**:
- Blue: 1.2884
- Green: 1.3823
- Red: 1.5535
- **Data Points**:
- ε = 0.008 (blue): Gradient updates rise from ~10² to ~10³ as dimension increases from 40 to 200.
- ε = 0.01 (green): Slightly higher than blue.
- ε = 0.012 (red): Steepest slope, with larger error bars.
- **Trend**: Lines diverge significantly at higher dimensions.
#### Bottom-Left Chart (Linear X-axis, Slope ~0.009)
- **Slope Values**:
- Blue: 0.0090
- Green: 0.0090
- Red: 0.0088
- **Data Points**:
- ε = 0.008 (blue): Gradient updates increase from ~10² to ~10³ as dimension rises from 50 to 250.
- ε = 0.01 (green): Identical slope to blue.
- ε = 0.012 (red): Slightly lower slope.
- **Trend**: Lines are nearly flat, with minimal variation between ε values.
#### Bottom-Right Chart (Log X-axis, Slope ~1.0–1.1)
- **Slope Values**:
- Blue: 1.0114
- Green: 1.0306
- Red: 1.0967
- **Data Points**:
- ε = 0.008 (blue): Gradient updates rise from ~10² to ~10³ as dimension increases from 40 to 200.
- ε = 0.01 (green): Slightly higher than blue.
- ε = 0.012 (red): Steepest slope, with larger error bars.
- **Trend**: Lines diverge at higher dimensions, with red (ε = 0.012) showing the sharpest increase.
---
### Key Observations
1. **Upward Trends**: All charts show gradient updates increasing with dimension, confirming a positive correlation.
2. **Slope Variability**:
- Higher ε values (e.g., 0.012) often correspond to steeper slopes, suggesting ε influences the rate of gradient updates.
- In log-scale x-axis charts, slopes are generally higher than linear-scale counterparts.
3. **Error Bars**: Larger error bars for ε = 0.012 (red) across most charts, indicating greater variability in gradient updates for this parameter.
4. **Convergence/Divergence**:
- In log-scale charts, lines converge at lower dimensions but diverge at higher dimensions, highlighting ε-dependent scaling behavior.
---
### Interpretation
The charts demonstrate that **gradient updates scale with dimension**, with the rate of increase modulated by the parameter ε. Higher ε values (e.g., 0.012) consistently produce steeper slopes, implying a stronger dependency on dimension under these conditions. The linear fits suggest a proportional relationship, but the log-scale x-axis charts reveal exponential-like growth at higher dimensions. The error bars for ε = 0.012 indicate higher uncertainty, possibly due to increased sensitivity to dimension changes. These results could inform optimization strategies in high-dimensional systems, where ε tuning might balance efficiency and stability.