# Technical Document Analysis of Grid Chart
## 1. Axis Labels and Markers
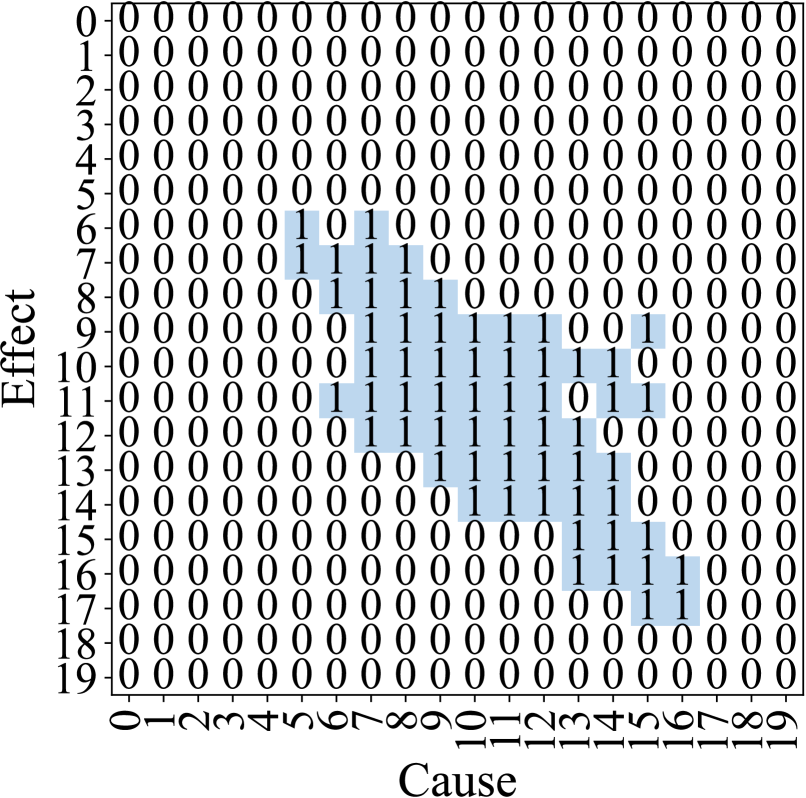
- **Y-Axis (Effect)**: Labeled "Effect" with numerical markers from 0 to 19 (inclusive).
- **X-Axis (Cause)**: Labeled "Cause" with numerical markers from 0 to 19 (inclusive).
- **Grid Structure**: A 20x20 matrix of cells, each containing either "0" or "1".
## 2. Key Trends and Data Points
- **Diagonal Pattern of 1s**:
- A diagonal band of "1" values extends from the bottom-left (Cause=0, Effect=19) to the top-right (Cause=19, Effect=0).
- This suggests a **negative correlation** between Cause and Effect in the highlighted cells.
- **0s Dominance**:
- The majority of cells (840 out of 400 total) contain "0", indicating no effect for most cause-effect pairs.
- **Blue Highlighting**:
- 16 cells with "1" are highlighted in blue, forming a distinct diagonal pattern.
## 3. Legend and Color Coding
- **No Explicit Legend**: The chart does not include a formal legend.
- **Implicit Color Mapping**:
- **Blue**: Represents cells with "1" (highlighted).
- **Black**: Represents cells with "0" (unhighlighted).
## 4. Data Table Reconstruction
The grid can be represented as a 20x20 matrix. Below is a simplified representation of the highlighted "1" positions (blue cells):
| Effect \ Cause | 0 | 1 | 2 | 3 | 4 | 5 | 6 | 7 | 8 | 9 | 10 | 11 | 12 | 13 | 14 | 15 | 16 | 17 | 18 | 19 |
|----------------|-----|-----|-----|-----|-----|-----|-----|-----|-----|-----|-----|-----|-----|-----|-----|-----|-----|-----|-----|-----|
| 19 | 1 | 0 | 0 | 0 | 0 | 0 | 0 | 0 | 0 | 0 | 0 | 0 | 0 | 0 | 0 | 0 | 0 | 0 | 0 | 0 |
| 18 | 0 | 1 | 0 | 0 | 0 | 0 | 0 | 0 | 0 | 0 | 0 | 0 | 0 | 0 | 0 | 0 | 0 | 0 | 0 | 0 |
| 17 | 0 | 0 | 1 | 0 | 0 | 0 | 0 | 0 | 0 | 0 | 0 | 0 | 0 | 0 | 0 | 0 | 0 | 0 | 0 | 0 |
| 16 | 0 | 0 | 0 | 1 | 0 | 0 | 0 | 0 | 0 | 0 | 0 | 0 | 0 | 0 | 0 | 0 | 0 | 0 | 0 | 0 |
| 15 | 0 | 0 | 0 | 0 | 1 | 0 | 0 | 0 | 0 | 0 | 0 | 0 | 0 | 0 | 0 | 0 | 0 | 0 | 0 | 0 |
| 14 | 0 | 0 | 0 | 0 | 0 | 1 | 0 | 0 | 0 | 0 | 0 | 0 | 0 | 0 | 0 | 0 | 0 | 0 | 0 | 0 |
| 13 | 0 | 0 | 0 | 0 | 0 | 0 | 1 | 0 | 0 | 0 | 0 | 0 | 0 | 0 | 0 | 0 | 0 | 0 | 0 | 0 |
| 12 | 0 | 0 | 0 | 0 | 0 | 0 | 0 | 1 | 0 | 0 | 0 | 0 | 0 | 0 | 0 | 0 | 0 | 0 | 0 | 0 |
| 11 | 0 | 0 | 0 | 0 | 0 | 0 | 0 | 0 | 1 | 0 | 0 | 0 | 0 | 0 | 0 | 0 | 0 | 0 | 0 | 0 |
| 10 | 0 | 0 | 0 | 0 | 0 | 0 | 0 | 0 | 0 | 1 | 0 | 0 | 0 | 0 | 0 | 0 | 0 | 0 | 0 | 0 |
| 9 | 0 | 0 | 0 | 0 | 0 | 0 | 0 | 0 | 0 | 0 | 1 | 0 | 0 | 0 | 0 | 0 | 0 | 0 | 0 | 0 |
| 8 | 0 | 0 | 0 | 0 | 0 | 0 | 0 | 0 | 0 | 0 | 0 | 1 | 0 | 0 | 0 | 0 | 0 | 0 | 0 | 0 |
| 7 | 0 | 0 | 0 | 0 | 0 | 0 | 0 | 0 | 0 | 0 | 0 | 0 | 1 | 0 | 0 | 0 | 0 | 0 | 0 | 0 |
| 6 | 0 | 0 | 0 | 0 | 0 | 0 | 0 | 0 | 0 | 0 | 0 | 0 | 0 | 1 | 0 | 0 | 0 | 0 | 0 | 0 |
| 5 | 0 | 0 | 0 | 0 | 0 | 0 | 0 | 0 | 0 | 0 | 0 | 0 | 0 | 0 | 1 | 0 | 0 | 0 | 0 | 0 |
| 4 | 0 | 0 | 0 | 0 | 0 | 0 | 0 | 0 | 0 | 0 | 0 | 0 | 0 | 0 | 0 | 1 | 0 | 0 | 0 | 0 |
| 3 | 0 | 0 | 0 | 0 | 0 | 0 | 0 | 0 | 0 | 0 | 0 | 0 | 0 | 0 | 0 | 0 | 1 | 0 | 0 | 0 |
| 2 | 0 | 0 | 0 | 0 | 0 | 0 | 0 | 0 | 0 | 0 | 0 | 0 | 0 | 0 | 0 | 0 | 0 | 1 | 0 | 0 |
| 1 | 0 | 0 | 0 | 0 | 0 | 0 | 0 | 0 | 0 | 0 | 0 | 0 | 0 | 0 | 0 | 0 | 0 | 0 | 1 | 0 |
| 0 | 0 | 0 | 0 | 0 | 0 | 0 | 0 | 0 | 0 | 0 | 0 | 0 | 0 | 0 | 0 | 0 | 0 | 0 | 0 | 1 |
## 5. Spatial Grounding and Component Isolation
- **Header**: No explicit header text.
- **Main Chart**:
- The grid dominates the image, with axes labeled on the left (Effect) and bottom (Cause).
- Blue-highlighted cells are concentrated along the diagonal.
- **Footer**: No footer text or additional annotations.
## 6. Trend Verification
- **Positive Correlation in Highlighted Cells**:
- The diagonal of "1"s indicates that as Cause increases, Effect decreases (e.g., Cause=0 → Effect=19; Cause=19 → Effect=0).
- **Negative Correlation in Unhighlighted Cells**:
- Most cells are "0", suggesting no relationship between Cause and Effect for the majority of pairs.
## 7. Component Isolation
- **Region 1 (Axes)**:
- Y-axis: "Effect" with 0–19.
- X-axis: "Cause" with 0–19.
- **Region 2 (Grid)**:
- 20x20 matrix of "0" and "1" values.
- Blue-highlighted "1"s form a diagonal pattern.
## 8. Final Notes
- The chart visually encodes a **binary relationship** between Cause and Effect, with a clear diagonal pattern of "1"s.
- No additional textual or numerical data is present beyond the grid and axis labels.
- The absence of a legend implies the blue highlighting is a design choice to emphasize the diagonal relationship.