## Heatmaps: Network Security Similarity
### Overview
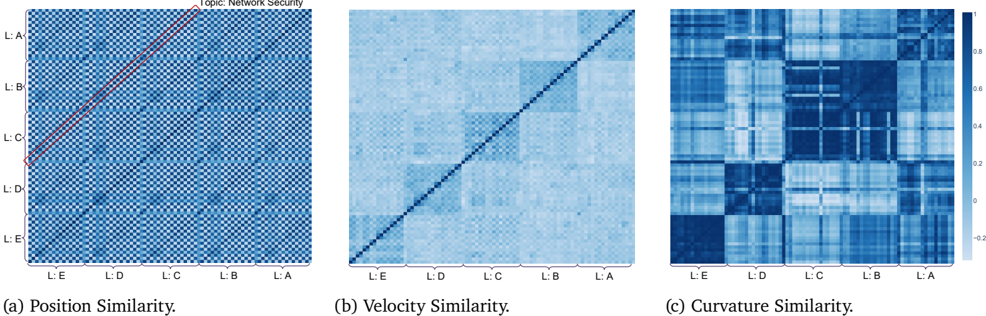
The image presents three heatmaps visualizing the similarity between different elements (labeled A through E) related to "Network Security". The heatmaps represent position similarity, velocity similarity, and curvature similarity. The color intensity indicates the degree of similarity, with darker blues representing higher similarity and lighter blues representing lower similarity.
### Components/Axes
* **Title:** Topic: Network Security (located at the top-right of the first heatmap)
* **Heatmap Labels (Y-axis):** L: A, L: B, L: C, L: D, L: E (arranged from top to bottom)
* **Heatmap Labels (X-axis):** L: E, L: D, L: C, L: B, L: A (arranged from left to right)
* **Color Scale:** A vertical color bar on the right side of the third heatmap indicates the similarity scale, ranging from approximately -0.2 to 0.8. The scale is marked with values -0.2, 0, 0.2, 0.4, 0.6, and 0.8. Darker blue represents higher values, and lighter blue represents lower values.
* **Heatmap Titles:**
* (a) Position Similarity.
* (b) Velocity Similarity.
* (c) Curvature Similarity.
### Detailed Analysis
#### (a) Position Similarity
* The heatmap displays a checkered pattern.
* A red line is drawn from the top-left corner (L: A vs L: E) to the bottom-right corner (L: E vs L: A).
* The diagonal elements (L:A vs L:A, L:B vs L:B, etc.) are not distinctly darker or lighter than the off-diagonal elements.
* The similarity values appear to be relatively uniform across the heatmap, with no strong clusters of high or low similarity.
#### (b) Velocity Similarity
* The heatmap shows a strong diagonal line of dark blue, indicating high similarity between elements and themselves.
* The off-diagonal elements are generally lighter in color, suggesting lower similarity.
* There are some blocks of slightly darker blue off the diagonal, indicating some degree of similarity between certain element pairs.
* Specifically, the top-left quadrant (L:E, L:D) and the bottom-right quadrant (L:B, L:A) show some elevated similarity compared to other off-diagonal regions.
#### (c) Curvature Similarity
* This heatmap exhibits a more complex pattern with distinct blocks of high and low similarity.
* The diagonal elements are generally dark blue, indicating high self-similarity.
* The top-left quadrant (L:E, L:D) shows high similarity.
* The bottom-right quadrant (L:B, L:A) also shows high similarity.
* The off-diagonal blocks show varying degrees of similarity, with some blocks being significantly darker or lighter than others.
### Key Observations
* **Self-Similarity:** All three heatmaps show high self-similarity along the diagonal, as expected.
* **Velocity Similarity:** Velocity similarity shows a clear distinction between self-similarity and similarity between different elements.
* **Curvature Similarity:** Curvature similarity reveals more complex relationships between the elements, with distinct clusters of high and low similarity.
* **Position Similarity:** Position similarity appears relatively uniform, suggesting that position alone does not strongly differentiate the elements.
### Interpretation
The heatmaps provide insights into the relationships between different elements (A through E) within the context of "Network Security".
* **Position Similarity:** The uniform pattern suggests that the absolute position of these elements is not a strong indicator of their relationship.
* **Velocity Similarity:** The strong diagonal indicates that each element is most similar to itself in terms of velocity. The off-diagonal elements suggest some degree of correlation in velocity between certain element pairs.
* **Curvature Similarity:** The complex pattern suggests that curvature is a more nuanced feature that can differentiate the elements. The distinct clusters of high and low similarity indicate specific relationships between certain element pairs in terms of their curvature.
The data suggests that while position may not be a strong differentiating factor, velocity and, particularly, curvature play a more significant role in defining the relationships between these elements in the context of network security. The curvature similarity heatmap could be used to identify groups of elements that behave similarly or to understand the underlying structure of the network security system.