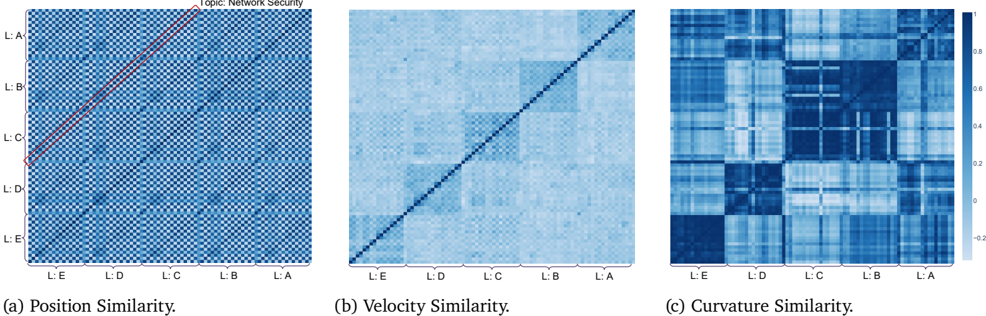
## Heatmaps: Similarity Matrices for Network Security Topic
### Overview
The image presents three heatmaps, labeled (a) Position Similarity, (b) Velocity Similarity, and (c) Curvature Similarity. Each heatmap visualizes a similarity matrix, likely representing the relationships between different elements (labeled L:A through L:E) within the context of "Topic: Network Security". The color intensity in each heatmap indicates the degree of similarity, with a colorbar on the right providing a scale from approximately -0.2 to 0.8.
### Components/Axes
Each heatmap shares the same structure:
* **Axes:** Both the x and y axes are labeled with "L:A", "L:B", "L:C", "L:D", and "L:E". These labels likely represent different entities or features related to network security.
* **Colorbar:** A vertical colorbar is present on the right side of all three heatmaps. The colorbar ranges from approximately -0.2 (dark blue) to 0.8 (dark red), representing the similarity score.
* **Labels:** Each heatmap is labeled with a descriptive title: "(a) Position Similarity.", "(b) Velocity Similarity.", and "(c) Curvature Similarity."
### Detailed Analysis or Content Details
**Heatmap (a): Position Similarity**
* **Trend:** The heatmap exhibits a strong diagonal pattern, indicating high similarity between elements with the same label (e.g., L:A and L:A). There is a slight deviation from the diagonal, with some off-diagonal elements showing a small degree of similarity.
* **Data Points:** The diagonal elements (L:A-L:A, L:B-L:B, L:C-L:C, L:D-L:D, L:E-L:E) are approximately 0.8. Off-diagonal elements are generally close to 0.0. A few off-diagonal elements show a slight positive correlation, around 0.1-0.2.
* **Color Distribution:** Predominantly light gray, with a strong dark red diagonal.
**Heatmap (b): Velocity Similarity**
* **Trend:** This heatmap shows a very strong diagonal pattern, even more pronounced than in (a). The similarity is highest between identical elements.
* **Data Points:** The diagonal elements are approximately 0.8. The off-diagonal elements are very close to 0.0.
* **Color Distribution:** Dominated by light blue and white, with a strong dark red diagonal.
**Heatmap (c): Curvature Similarity**
* **Trend:** This heatmap displays a more complex pattern than the previous two. While still having a diagonal, there are significant off-diagonal elements with varying degrees of similarity. There are blocks of higher similarity both above and below the diagonal.
* **Data Points:** The diagonal elements are approximately 0.6-0.8. There are several off-diagonal elements with similarity scores ranging from 0.2 to 0.6. Some elements show negative correlation, with values around -0.2.
* **Color Distribution:** A mix of light blue, white, and dark red, with a more complex pattern than the other two heatmaps.
### Key Observations
* **Position and Velocity Similarity:** These heatmaps show a strong correlation between elements with the same label, suggesting that the position and velocity of these elements are highly consistent.
* **Curvature Similarity:** The curvature similarity heatmap shows a more nuanced relationship, with some elements exhibiting similarity even when their labels differ. This suggests that the curvature of these elements may be related, even if their positions and velocities are not.
* **Symmetry:** All three heatmaps appear to be symmetric along the diagonal, indicating that the similarity between element X and element Y is the same as the similarity between element Y and element X.
### Interpretation
These heatmaps likely represent the similarity between different features or entities within a network security context. The "Position," "Velocity," and "Curvature" likely refer to characteristics of network traffic, user behavior, or system states.
* **Position Similarity** suggests that elements with similar positions (e.g., source/destination IP addresses, ports) are more likely to be related.
* **Velocity Similarity** indicates that elements with similar rates of change (e.g., packet rates, connection attempts) are more likely to be related.
* **Curvature Similarity** suggests that elements with similar patterns of change (e.g., fluctuations in traffic volume, changes in user activity) are more likely to be related.
The fact that the curvature similarity heatmap shows more complex patterns than the other two suggests that curvature is a more informative feature for identifying relationships between elements. The negative correlations in the curvature similarity heatmap may indicate adversarial behavior or anomalies.
The overall goal of these similarity matrices is likely to identify clusters of related elements, which can then be used for anomaly detection, threat identification, or network optimization. The strong diagonal patterns in the position and velocity similarity matrices suggest that these features are relatively stable and predictable, while the more complex pattern in the curvature similarity matrix suggests that curvature is a more dynamic and informative feature.