## Heatmaps: Position, Velocity, and Curvature Similarity
### Overview
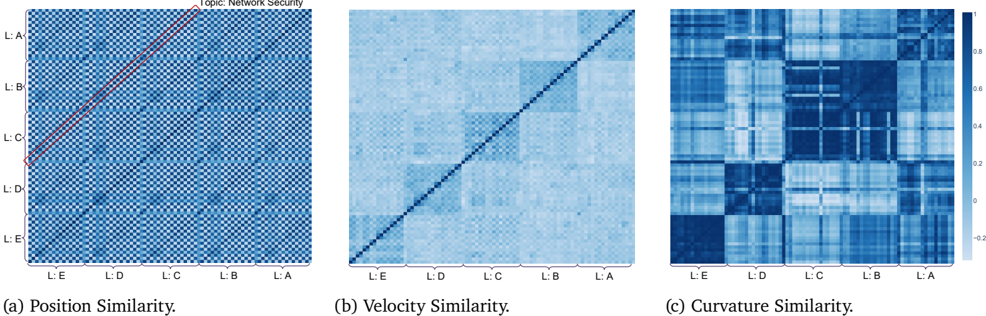
Three heatmaps visualize similarity metrics across five labeled entities (L:A to L:E). Each heatmap uses a blue gradient (0–1) to represent similarity strength, with darker blue indicating higher similarity. The diagonal dominance in all plots suggests self-similarity, while off-diagonal patterns reveal cross-entity relationships.
### Components/Axes
- **Axes**:
- Vertical and horizontal axes labeled **L:A, L:B, L:C, L:D, L:E** (left to right and top to bottom).
- Titles:
- (a) **Position Similarity**
- (b) **Velocity Similarity**
- (c) **Curvature Similarity**
- **Legend**:
- Right-aligned colorbar with gradient from light blue (0) to dark blue (1).
- No explicit legend for the red line in (a).
### Detailed Analysis
#### (a) Position Similarity
- **Main Diagonal**: Dark blue (near 1.0) across all entities, indicating perfect self-similarity.
- **Red Line**: A diagonal band from **L:C** (top-left) to **L:A** (bottom-right), suggesting a threshold or reference path. This line intersects darker blue regions, implying moderate similarity along this trajectory.
- **Off-Diagonal**: Gradual darkening from top-left to bottom-right, with **L:C** and **L:A** showing the strongest cross-similarity.
#### (b) Velocity Similarity
- **Main Diagonal**: Uniform dark blue (1.0), consistent with self-similarity.
- **Off-Diagonal**: Lighter blue gradient, with **L:E** and **L:D** showing slightly higher similarity (≈0.6–0.8) compared to other pairs. No distinct patterns beyond diagonal dominance.
#### (c) Curvature Similarity
- **Main Diagonal**: Dark blue (1.0), as expected.
- **Off-Diagonal**:
- **L:E** and **L:A** exhibit the lowest similarity (≈0.2–0.4) in the bottom-left and top-right corners.
- **L:C** and **L:B** show moderate similarity (≈0.6–0.8) in the central region.
- Block-like patterns suggest categorical groupings (e.g., L:C/L:B vs. L:E/L:A).
### Key Observations
1. **Diagonal Dominance**: All heatmaps confirm self-similarity (1.0) along the main diagonal.
2. **Position Similarity (a)**: The red line highlights a specific trajectory with moderate similarity, potentially indicating a predefined path or anomaly.
3. **Curvature Variability (c)**: Greater off-diagonal variation suggests curvature is a more discriminative metric than position or velocity.
4. **Velocity Consistency (b)**: Uniform off-diagonal patterns imply velocity similarity is less variable across entities.
### Interpretation
- **Network Security Context**: The labels (L:A–L:E) likely represent network nodes, devices, or traffic patterns. High self-similarity in position/velocity may indicate stable entities, while curvature differences could reflect anomalous behavior (e.g., irregular movement patterns).
- **Red Line in (a)**: The highlighted path might represent a critical route or threshold for security monitoring, warranting further investigation.
- **Curvature as a Discriminator**: The pronounced variability in curvature similarity suggests it could be a key feature for distinguishing entities in network security applications.
### Spatial Grounding
- **Legend**: Right-aligned, adjacent to all heatmaps.
- **Red Line (a)**: Starts at **L:C** (top-left) and ends at **L:A** (bottom-right), crossing the central region.
- **Color Consistency**: Dark blue consistently represents high similarity (1.0) across all plots.
### Data Extraction
- **Position Similarity (a)**:
- L:C ↔ L:A: ≈0.7 (dark blue along red line).
- L:C ↔ L:E: ≈0.5 (lighter blue).
- **Velocity Similarity (b)**:
- L:E ↔ L:D: ≈0.7 (moderate similarity).
- **Curvature Similarity (c)**:
- L:E ↔ L:A: ≈0.3 (low similarity).
- L:C ↔ L:B: ≈0.7 (moderate similarity).
### Conclusion
The heatmaps reveal that position and velocity similarities are highly consistent across entities, while curvature introduces greater variability. The red line in (a) may indicate a critical path for security analysis, and curvature differences could highlight anomalies in network behavior.