## Bar Chart: Number of Files per Category
### Overview
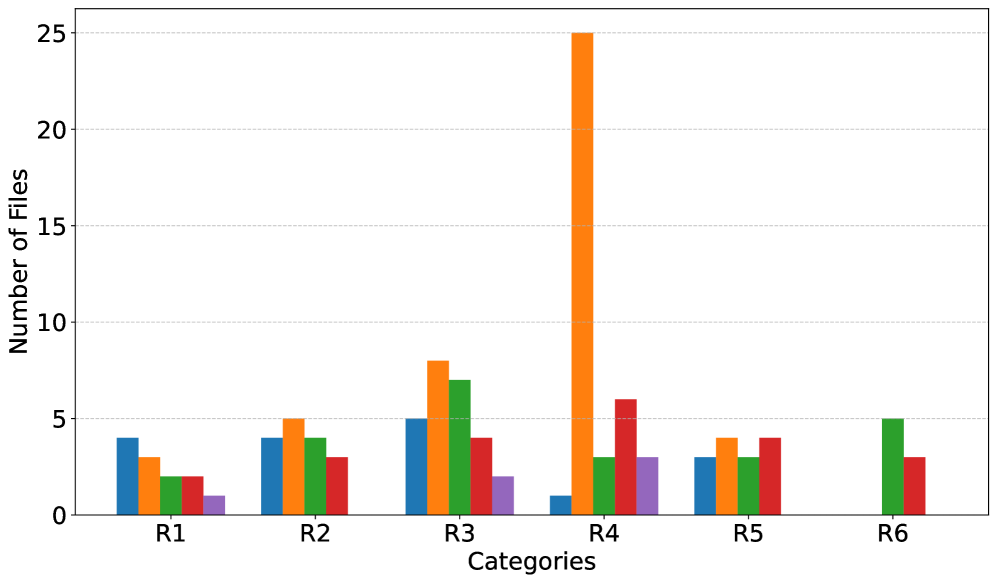
The image is a bar chart comparing the number of files across six categories (R1 to R6). Each category has five bars of different colors, presumably representing different file types or attributes. The chart highlights a significant spike in the number of files for one color in category R4.
### Components/Axes
* **X-axis:** "Categories" labeled as R1, R2, R3, R4, R5, and R6.
* **Y-axis:** "Number of Files" ranging from 0 to 25, with gridlines at intervals of 5.
* **Bars:** Five bars for each category, each with a distinct color (blue, orange, green, red, and purple). There is no legend provided, so the meaning of each color is unknown.
### Detailed Analysis
Here's a breakdown of the approximate number of files for each category and color:
* **R1:**
* Blue: ~4
* Orange: ~3
* Green: ~2
* Red: ~2
* Purple: ~1
* **R2:**
* Blue: ~4
* Orange: ~5
* Green: ~4
* Red: ~3
* Purple: ~1
* **R3:**
* Blue: ~5
* Orange: ~8
* Green: ~7
* Red: ~4
* Purple: ~2
* **R4:**
* Blue: ~1
* Orange: ~25
* Green: ~3
* Red: ~6
* Purple: ~3
* **R5:**
* Blue: ~3
* Orange: ~3
* Green: ~3
* Red: ~4
* Purple: ~2
* **R6:**
* Blue: ~0
* Orange: ~0
* Green: ~5
* Red: ~3
* Purple: ~0
### Key Observations
* Category R4 has a significantly higher number of files compared to other categories, primarily driven by the orange bar.
* Categories R1, R2, R3, and R5 have relatively similar distributions across the different colored bars.
* Category R6 has only green and red bars present.
### Interpretation
The chart suggests that category R4 is an outlier, containing a disproportionately large number of files of the type represented by the orange bar. The other categories have a more balanced distribution of file types. Without a legend, it's impossible to determine the specific meaning of each color, but the chart clearly highlights the dominance of the orange-colored files in category R4. The absence of blue, orange, and purple bars in category R6 is also notable.