# Technical Document Extraction: Scatter Plot Analysis
## Key Components
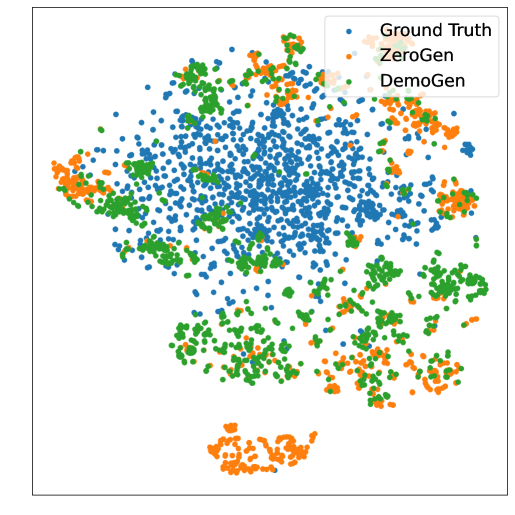
- **Legend**: Located in the top-right corner, categorizes data points into three groups:
- **Ground Truth**: Blue dots
- **ZeroGen**: Orange dots
- **DemoGen**: Green dots
## Data Distribution
1. **Ground Truth** (Blue):
- Central cluster dominates the plot.
- High density in the middle region.
- Sparse outliers extend toward peripheral areas.
2. **ZeroGen** (Orange):
- Concentrated in the bottom-right quadrant.
- Smaller clusters interspersed near the central region.
- Minimal overlap with Ground Truth.
3. **DemoGen** (Green):
- Primary cluster in the bottom-left quadrant.
- Smaller groupings near the central region.
- Moderate overlap with Ground Truth in transitional zones.
## Observations
- **Clustering Patterns**:
- Ground Truth forms the core distribution.
- ZeroGen and DemoGen exhibit peripheral clustering with limited central representation.
- **Overlap**:
- Significant overlap between DemoGen and Ground Truth in mid-lower regions.
- Minimal overlap between ZeroGen and other categories.
- **Spatial Trends**:
- Ground Truth density decreases radially outward.
- ZeroGen and DemoGen show localized clustering with no clear gradient.
## Structural Notes
- No axis titles or numerical markers are present in the plot.
- All data points are uniformly sized; no gradient or categorical encoding beyond color.
- No textual annotations or labels embedded within the plot area.
## Cross-Reference Validation
- Legend colors (blue, orange, green) match all corresponding data points in the plot.
- No discrepancies between legend labels and visual representation.