## 2x2 Grid of Line Graphs: Comparative Analysis of Variables Across α
### Overview
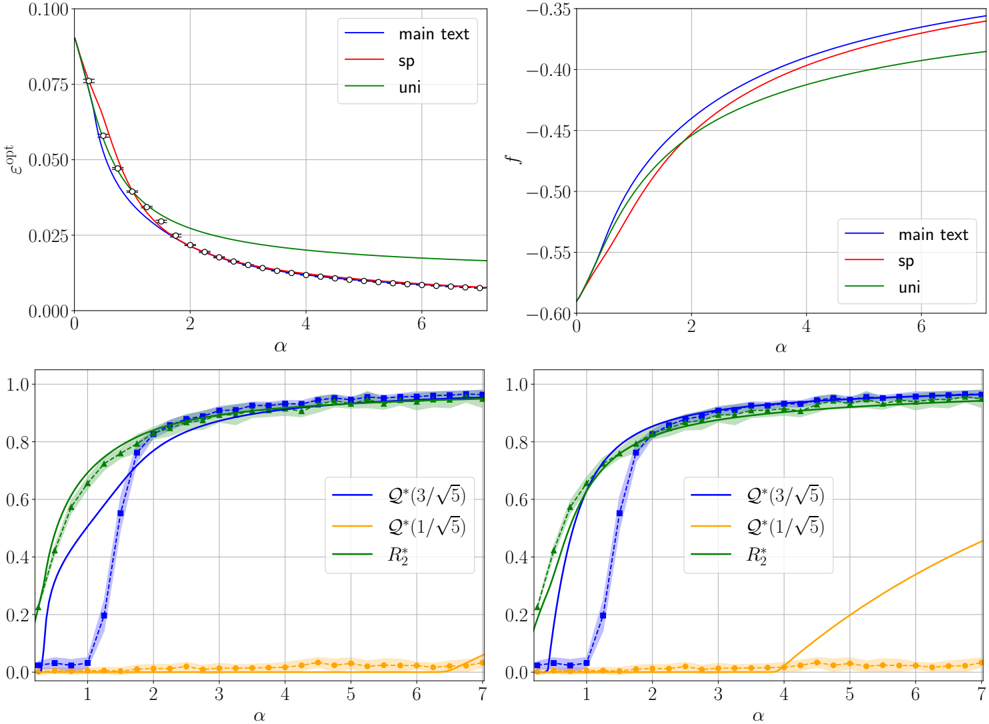
The image contains four line graphs arranged in a 2x2 grid, each comparing different mathematical or statistical relationships as functions of the variable α (x-axis). All graphs share the same x-axis range (0–7) but differ in y-axis metrics and data series. The graphs use color-coded lines with legends for clarity.
---
### Components/Axes
1. **Top-Left Graph**
- **Y-axis**: ε_opt (0.000–0.100)
- **X-axis**: α (0–7)
- **Legend**:
- Blue: "main text"
- Red: "sp"
- Green: "uni"
- **Data Points**: Marked with open circles (○).
2. **Top-Right Graph**
- **Y-axis**: f (-0.60–-0.35)
- **X-axis**: α (0–7)
- **Legend**:
- Blue: "main text"
- Red: "sp"
- Green: "uni"
3. **Bottom-Left Graph**
- **Y-axis**: Probability (0.0–1.0)
- **X-axis**: α (0–7)
- **Legend**:
- Blue: Q*(3/√5)
- Orange: Q*(1/√5)
- Green: R₂*
4. **Bottom-Right Graph**
- **Y-axis**: Probability (0.0–1.0)
- **X-axis**: α (0–7)
- **Legend**:
- Blue: Q*(3/√5)
- Orange: Q*(1/√5)
- Green: R₂*
---
### Detailed Analysis
#### Top-Left Graph (ε_opt vs. α)
- **Trend**: All lines decrease monotonically as α increases.
- **Key Data Points**:
- At α=0: ε_opt ≈ 0.09 (all lines overlap).
- At α=2: Blue ≈ 0.075, Red ≈ 0.065, Green ≈ 0.06.
- At α=6: Blue ≈ 0.02, Red ≈ 0.018, Green ≈ 0.015.
- **Divergence**: Blue ("main text") remains consistently above Red ("sp") and Green ("uni"), which converge slightly at higher α.
#### Top-Right Graph (f vs. α)
- **Trend**: All lines increase (become less negative) as α increases.
- **Key Data Points**:
- At α=0: f ≈ -0.55 (all lines overlap).
- At α=4: Blue ≈ -0.4, Red ≈ -0.42, Green ≈ -0.45.
- At α=6: Blue ≈ -0.35, Red ≈ -0.38, Green ≈ -0.4.
- **Divergence**: Blue ("main text") rises fastest, followed by Red ("sp"), then Green ("uni").
#### Bottom-Left Graph (Probability vs. α)
- **Trend**:
- Blue (Q*(3/√5)): Sharp rise at α≈1.5, plateaus near 0.8.
- Orange (Q*(1/√5)): Near 0 until α≈6, then rises sharply.
- Green (R₂*): Follows Blue’s initial rise but plateaus earlier (~α=3).
- **Key Data Points**:
- At α=1: Blue ≈ 0.2, Orange ≈ 0.01, Green ≈ 0.2.
- At α=3: Blue ≈ 0.8, Orange ≈ 0.02, Green ≈ 0.75.
- At α=6: Blue ≈ 0.85, Orange ≈ 0.03, Green ≈ 0.8.
#### Bottom-Right Graph (Probability vs. α)
- **Trend**:
- Blue (Q*(3/√5)): Plateaus near 0.85 by α=3.
- Orange (Q*(1/√5)): Near 0 until α≈6, then rises to ~0.1.
- Green (R₂*): Rises gradually, surpassing Blue after α=5.
- **Key Data Points**:
- At α=5: Blue ≈ 0.85, Orange ≈ 0.02, Green ≈ 0.82.
- At α=7: Blue ≈ 0.85, Orange ≈ 0.1, Green ≈ 0.9.
---
### Key Observations
1. **Top-Left/Right Graphs**:
- "main text" (blue) consistently outperforms "sp" (red) and "uni" (green) in both ε_opt and f metrics.
- "sp" and "uni" show similar trends but diverge slightly at higher α.
2. **Bottom Graphs**:
- Q*(3/√5) (blue) dominates early, while Q*(1/√5) (orange) lags until α≈6.
- R₂* (green) bridges the gap between Q* terms, peaking earlier but being overtaken by Q*(3/√5) in the bottom-right graph.
3. **Anomalies**:
- In the bottom-left graph, Q*(1/√5) (orange) remains near 0 until α=6, suggesting delayed activation.
- R₂* (green) in the bottom-right graph surpasses Q*(3/√5) after α=5, indicating a late-stage advantage.
---
### Interpretation
- **Top Graphs**: The "main text" model (blue) appears optimal for minimizing ε_opt and maximizing f, suggesting it represents a preferred or baseline configuration.
- **Bottom Graphs**:
- Q*(3/√5) (blue) and R₂* (green) represent complementary strategies: Q* excels early, while R₂* becomes competitive later.
- Q*(1/√5) (orange) may model a delayed or resource-constrained scenario, activating only at higher α.
- **Cross-Graph Insights**:
- The divergence in ε_opt and f trends implies trade-offs between stability (ε_opt) and performance (f).
- Probability graphs highlight threshold behaviors, with Q* terms showing step-like transitions at specific α values.
This analysis suggests the graphs model system behavior under varying α, with distinct strategies (Q*, R₂*) offering different advantages depending on the metric and α range.