## Heatmap: Needle In A Haystack Testing
### Overview
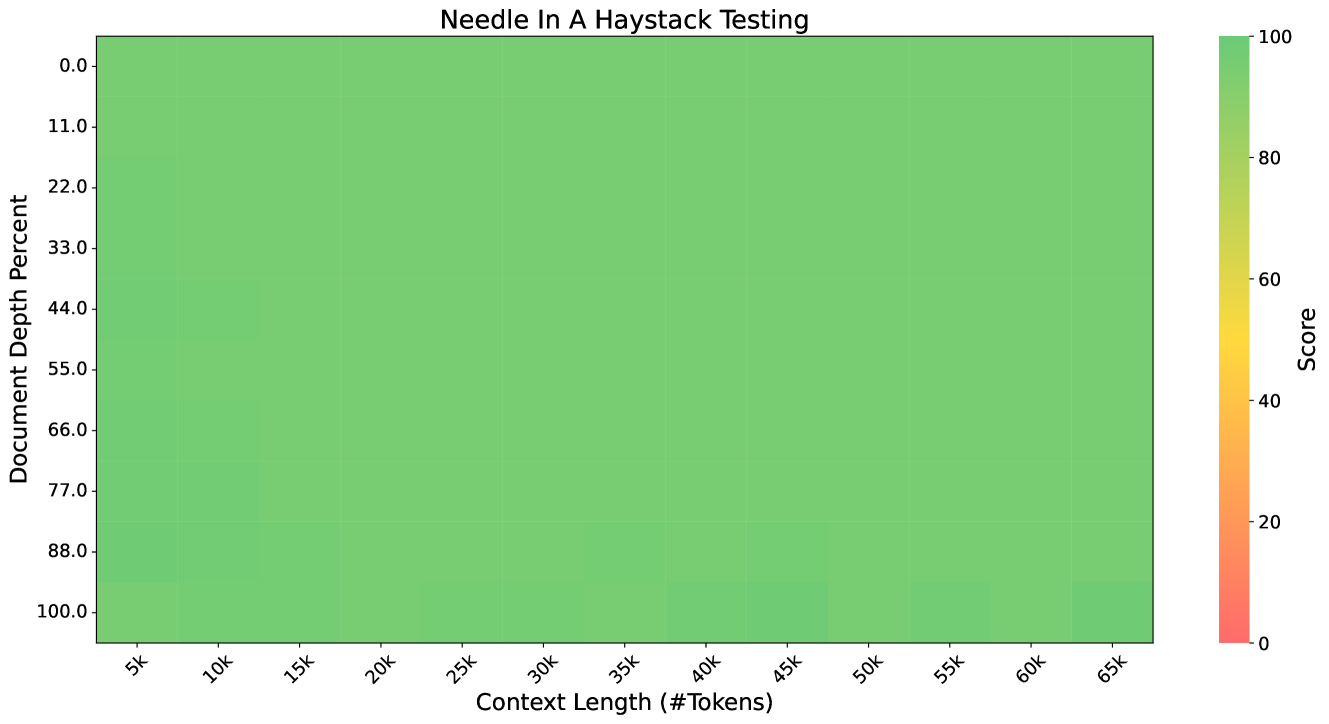
The image is a heatmap titled "Needle In A Haystack Testing," visualizing the relationship between **Context Length (# Tokens)** and **Document Depth Percent** in terms of a "Score." The heatmap uses a color gradient from red (low scores) to green (high scores), with a legend on the right. Most cells are green, indicating high scores, but darker green areas in the lower left suggest lower scores in that region.
---
### Components/Axes
- **X-Axis (Horizontal)**:
- Label: "Context Length (# Tokens)"
- Categories: 5k, 10k, 15k, 20k, 25k, 30k, 35k, 40k, 45k, 50k, 55k, 60k, 65k
- Position: Bottom of the chart.
- **Y-Axis (Vertical)**:
- Label: "Document Depth Percent"
- Categories: 0.0, 11.0, 22.0, 33.0, 44.0, 55.0, 66.0, 77.0, 88.0, 100.0
- Position: Left side of the chart.
- **Legend**:
- Label: "Score"
- Color Scale: Red (0) to Green (100)
- Position: Right side of the chart.
- **Title**:
- "Needle In A Haystack Testing"
- Position: Top center of the chart.
---
### Detailed Analysis
- **Color Distribution**:
- Most cells are bright green, indicating high scores (near 100).
- Darker green areas appear in the **lower left corner** (5k–10k context length, 0.0–11.0 document depth), suggesting lower scores in this region.
- No red cells are visible, implying no scores below 0.
- **Trends**:
- Scores generally increase with **longer context lengths** (e.g., 65k context length has uniformly high scores).
- Scores also improve with **higher document depth** (e.g., 100.0 document depth has consistently high scores).
- The lower left corner (short context, low document depth) shows the weakest performance.
---
### Key Observations
1. **High Scores Dominate**: The majority of the heatmap is green, indicating strong performance across most context lengths and document depths.
2. **Lower Left Anomaly**: The darker green in the lower left (5k–10k context, 0.0–11.0 document depth) suggests a drop in scores, contradicting the general trend.
3. **No Red Zones**: No cells are red, meaning no scores below 0.
---
### Interpretation
The heatmap demonstrates that the model performs well in most scenarios, with scores approaching 100 for longer context lengths and higher document depths. However, the lower left corner (short context, low document depth) shows a notable decline in performance, suggesting potential limitations in handling sparse or shallow data. The absence of red cells implies the model never fails entirely, but the darker green areas highlight areas for optimization. The relationship between context length and document depth indicates that increasing both parameters improves the model's ability to "find the needle in the haystack."