## Scatter Plot: medical_genetics
### Overview
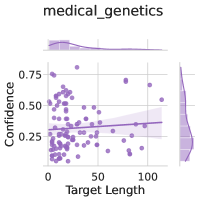
The image is a scatter plot titled "medical_genetics". It displays the relationship between "Target Length" on the x-axis and "Confidence" on the y-axis. The plot includes a regression line with a shaded confidence interval. Histograms are displayed along the top and right edges, showing the distributions of Target Length and Confidence, respectively.
### Components/Axes
* **Title:** medical\_genetics
* **X-axis:**
* Label: Target Length
* Scale: 0 to 100, with tick marks at approximately 0, 50, and 100.
* **Y-axis:**
* Label: Confidence
* Scale: 0 to 0.75, with tick marks at approximately 0, 0.25, 0.50, and 0.75.
* **Data Points:** Purple dots representing individual data points.
* **Regression Line:** A purple line showing the linear regression fit to the data.
* **Confidence Interval:** A shaded purple area around the regression line, representing the confidence interval.
* **Histograms:**
* Top: Distribution of Target Length.
* Right: Distribution of Confidence.
### Detailed Analysis
* **Data Points:** The data points are scattered across the plot. Most points are concentrated between Target Length 0-50 and Confidence 0-0.5.
* **Regression Line:** The regression line has a slight positive slope, indicating a weak positive correlation between Target Length and Confidence.
* **Confidence Interval:** The shaded area around the regression line suggests a relatively wide confidence interval, indicating uncertainty in the regression fit.
* **Target Length Distribution:** The histogram on top shows that the Target Length is skewed to the right, with most values concentrated at the lower end.
* **Confidence Distribution:** The histogram on the right shows that the Confidence is also skewed, with a peak around 0.25.
### Key Observations
* There is a weak positive correlation between Target Length and Confidence.
* The data points are concentrated in the lower-left region of the plot.
* The distributions of both Target Length and Confidence are skewed.
### Interpretation
The scatter plot suggests a weak positive relationship between the target length and confidence in the medical genetics context. The concentration of data points at lower target lengths and confidence values indicates that most observations fall within this range. The skewed distributions of both variables further support this observation. The wide confidence interval around the regression line suggests that the relationship is not very strong or precise. The data suggests that as target length increases, there is a slight tendency for confidence to increase as well, but this trend is not very pronounced.