## Scatter Plot with Marginal Distributions: Medical Genetics Confidence vs. Target Length
### Overview
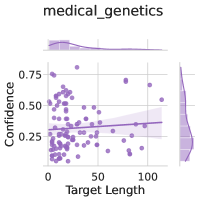
The image is a scatter plot titled "medical_genetics" that visualizes the relationship between "Target Length" (x-axis) and "Confidence" (y-axis). The plot includes a fitted trend line with a confidence interval and marginal distribution plots (histograms/density plots) on the top and right edges. The primary data is represented by purple points.
### Components/Axes
* **Title:** "medical_genetics" (centered at the top).
* **X-Axis:**
* **Label:** "Target Length"
* **Scale:** Linear, ranging from 0 to approximately 120.
* **Major Tick Marks:** 0, 50, 100.
* **Y-Axis:**
* **Label:** "Confidence"
* **Scale:** Linear, ranging from 0.0 to approximately 0.9.
* **Major Tick Marks:** 0.25, 0.50, 0.75.
* **Legend:** Located in the top-left corner of the main plot area. It contains a single entry: a purple circle symbol followed by the text "medical_genetics". This identifies the data series.
* **Main Plot Area:** Contains a scatter of purple data points and a solid purple trend line with a semi-transparent purple shaded region representing the confidence interval.
* **Marginal Plots:**
* **Top Marginal Plot:** A density plot (or smoothed histogram) showing the distribution of the "Target Length" variable. It is positioned above the main x-axis.
* **Right Marginal Plot:** A density plot showing the distribution of the "Confidence" variable. It is positioned to the right of the main y-axis.
### Detailed Analysis
* **Data Series (medical_genetics):**
* **Visual Trend:** The data points show a weak to moderate positive correlation. As "Target Length" increases, "Confidence" tends to increase slightly. The fitted trend line has a clear, gentle upward slope from left to right.
* **Data Point Distribution:**
* The points are densely clustered in the lower-left quadrant, specifically where "Target Length" is between 0-50 and "Confidence" is between 0.15-0.50.
* There is a significant spread of "Confidence" values for any given "Target Length," indicating high variance.
* Several outlier points exist with high "Confidence" (>0.75) at various "Target Lengths," and a few points with very low "Confidence" (<0.15).
* **Trend Line & Confidence Interval:** The solid purple regression line starts at approximately (0, 0.25) and ends near (120, 0.40). The shaded confidence interval band widens slightly as "Target Length" increases, suggesting greater uncertainty in the trend estimate for larger target lengths.
* **Marginal Distributions:**
* **Target Length (Top):** The distribution is right-skewed. The highest density is for shorter target lengths (0-30), with a long tail extending towards 120.
* **Confidence (Right):** The distribution is roughly unimodal and slightly left-skewed. The peak density is around a confidence value of 0.30-0.35, with a tail extending towards higher confidence values.
### Key Observations
1. **Positive Correlation:** There is a discernible, albeit noisy, positive relationship between the length of a genetic target and the confidence metric.
2. **High Variance:** Confidence values are highly variable, especially for shorter target lengths, suggesting factors other than length significantly influence confidence.
3. **Right-Skewed Target Length:** The dataset is dominated by genetic targets of shorter length.
4. **Outliers:** A subset of data points achieves high confidence (>0.75) across the range of target lengths, which may represent particularly well-characterized or unambiguous genetic targets.
### Interpretation
This plot from the "medical_genetics" domain suggests that, on average, longer genetic targets are associated with slightly higher confidence scores. This could imply that longer sequences provide more information or context, leading to more reliable analysis or predictions. However, the high scatter indicates that target length is not the primary determinant of confidence. The right-skew in target length distribution means the trend is more heavily informed by shorter targets. The outliers with high confidence at short lengths are particularly interesting, as they may represent ideal, high-confidence markers or regions that defy the general trend. The marginal plots confirm the concentration of data in the low-length, moderate-confidence region, which is the most common scenario in this dataset.