## Scatter Plot: Confidence vs. Target Length in Medical Genetics
### Overview
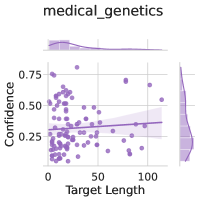
The image is a scatter plot titled "medical_genetics" showing the relationship between "Target Length" (x-axis) and "Confidence" (y-axis). A trend line with a shaded confidence interval is overlaid on the data points. The plot includes a legend, axis labels, and numerical markers.
---
### Components/Axes
- **Title**: "medical_genetics" (top-center).
- **X-axis**:
- Label: "Target Length" (bottom).
- Scale: 0 to 100, with ticks at 0, 25, 50, 75, 100.
- **Y-axis**:
- Label: "Confidence" (left).
- Scale: 0.25 to 0.75, with ticks at 0.25, 0.5, 0.75.
- **Legend**:
- Position: Top-left corner.
- Label: "Confidence Interval" (purple).
- **Data Points**: Purple dots scattered across the plot.
- **Trend Line**: Solid purple line with a shaded confidence interval (lighter purple).
---
### Detailed Analysis
1. **Trend Line**:
- Slope: Slightly upward (positive correlation between Target Length and Confidence).
- Equation: Not explicitly provided, but visually approximated as a linear increase.
- Confidence Interval: Shaded area around the trend line widens as Target Length increases, indicating greater uncertainty at higher values.
2. **Data Points**:
- Distribution:
- Dense clustering in the lower-left (low Target Length, low Confidence).
- Sparse points in the upper-right (high Target Length, high Confidence).
- Notable Outliers:
- A single point at (100, 0.75) (highest Confidence).
- A cluster near (50, 0.5) (moderate values).
3. **Confidence Interval**:
- Width: Narrows at low Target Lengths (e.g., ~0.1 at Target Length 0) and widens to ~0.3 at Target Length 100.
- Color: Matches the legend's "Confidence Interval" (light purple).
---
### Key Observations
- **Positive Correlation**: Confidence generally increases with Target Length, but the relationship is not perfectly linear.
- **Increasing Uncertainty**: The widening confidence interval at higher Target Lengths suggests predictions become less reliable for longer targets.
- **Outlier Behavior**: The point at (100, 0.75) deviates from the trend, indicating an exceptional case or potential data anomaly.
- **Density Patterns**: Most data points cluster below the trend line, particularly at lower Target Lengths.
---
### Interpretation
The plot demonstrates a nuanced relationship between Target Length and Confidence in medical genetics. While longer targets correlate with higher confidence, the widening confidence interval implies diminishing reliability for predictions at extreme lengths. The outlier at (100, 0.75) may represent a high-confidence exception or a data point requiring further validation. The shaded confidence interval visually emphasizes the trade-off between precision and uncertainty, critical for applications where overconfidence in predictions could have significant consequences. The sparse distribution at high Confidence values suggests that achieving near-maximal confidence is rare, even for longer targets.