## Line Charts: Accuracy vs. DTR for AIME 25 and GPQA-D
### Overview
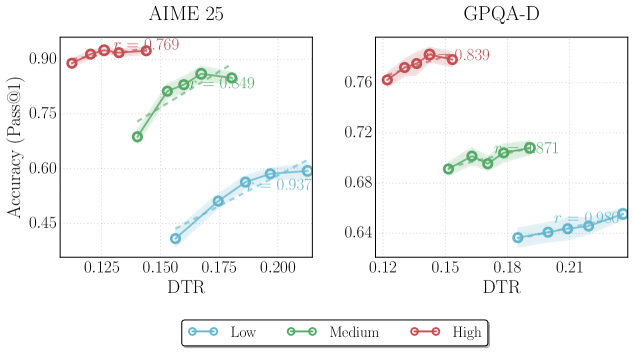
The image contains two line charts comparing the accuracy (Pass@1) against DTR (Decoding Temperature Ratio) for two datasets: AIME 25 and GPQA-D. Each chart displays three data series representing "Low", "Medium", and "High" levels, presumably of some experimental parameter. The charts show how accuracy changes with DTR for each level.
### Components/Axes
**Chart 1: AIME 25**
* **Title:** AIME 25
* **X-axis:** DTR (Decoding Temperature Ratio)
* Scale: Approximately 0.125 to 0.200, with increments of 0.025.
* Markers: 0.125, 0.150, 0.175, 0.200
* **Y-axis:** Accuracy (Pass@1)
* Scale: Approximately 0.45 to 0.90, with increments of 0.15.
* Markers: 0.45, 0.60, 0.75, 0.90
* **Data Series:**
* **Low (Blue):** Starts around (0.125, 0.45) and increases to approximately (0.200, 0.60).
* **Medium (Green):** Starts around (0.150, 0.73) and increases to approximately (0.200, 0.85).
* **High (Red):** Starts around (0.125, 0.90) and remains relatively constant around 0.90.
* **Correlation Coefficients (r):**
* Low (Blue): r = 0.937, located near the top-right of the blue line.
* Medium (Green): r = 0.849, located near the top-right of the green line.
* High (Red): r = 0.769, located near the top-right of the red line.
**Chart 2: GPQA-D**
* **Title:** GPQA-D
* **X-axis:** DTR (Decoding Temperature Ratio)
* Scale: Approximately 0.12 to 0.21, with increments of 0.03.
* Markers: 0.12, 0.15, 0.18, 0.21
* **Y-axis:** Accuracy (Pass@1)
* Scale: Approximately 0.64 to 0.76, with increments of 0.04.
* Markers: 0.64, 0.68, 0.72, 0.76
* **Data Series:**
* **Low (Blue):** Starts around (0.18, 0.64) and increases slightly to approximately (0.21, 0.65).
* **Medium (Green):** Starts around (0.15, 0.70) and remains relatively constant around 0.70.
* **High (Red):** Starts around (0.12, 0.76) and remains relatively constant around 0.77.
* **Correlation Coefficients (r):**
* Low (Blue): r = 0.986, located near the top-right of the blue line.
* Medium (Green): r = 0.871, located near the top-right of the green line.
* High (Red): r = 0.839, located near the top-right of the red line.
**Legend:**
* Located at the bottom center of the image.
* Low: Blue line with circle markers.
* Medium: Green line with circle markers.
* High: Red line with circle markers.
### Detailed Analysis
**AIME 25 Chart:**
* **Low (Blue):** The accuracy increases steadily with DTR, starting from approximately 0.45 at DTR 0.125 to about 0.60 at DTR 0.200.
* **Medium (Green):** The accuracy increases from approximately 0.73 at DTR 0.150 to about 0.85 at DTR 0.200.
* **High (Red):** The accuracy starts at approximately 0.90 at DTR 0.125 and remains relatively constant around 0.90 as DTR increases.
**GPQA-D Chart:**
* **Low (Blue):** The accuracy increases slightly with DTR, starting from approximately 0.64 at DTR 0.18 to about 0.65 at DTR 0.21.
* **Medium (Green):** The accuracy remains relatively constant around 0.70 as DTR increases from 0.15 to 0.18.
* **High (Red):** The accuracy remains relatively constant around 0.77 as DTR increases from 0.12 to 0.15.
### Key Observations
* For AIME 25, the "High" level consistently yields the highest accuracy, while "Low" yields the lowest. Accuracy generally increases with DTR for "Low" and "Medium" levels.
* For GPQA-D, the "High" level also yields the highest accuracy, while "Low" yields the lowest. The accuracy changes are less pronounced with DTR compared to AIME 25.
* The correlation coefficients (r) are generally high, indicating a strong positive relationship between DTR and accuracy, especially for the "Low" level in both datasets.
### Interpretation
The charts suggest that the Decoding Temperature Ratio (DTR) has a varying impact on accuracy depending on the dataset (AIME 25 vs. GPQA-D) and the level of the experimental parameter ("Low", "Medium", "High"). For AIME 25, increasing DTR seems to improve accuracy for "Low" and "Medium" levels, while "High" remains consistently high. For GPQA-D, the impact of DTR is less significant, with accuracy remaining relatively stable across different DTR values. The high correlation coefficients indicate a strong positive relationship between DTR and accuracy, particularly for the "Low" level, suggesting that increasing DTR can be beneficial in certain scenarios. The "High" level consistently achieves the highest accuracy, implying that this setting is optimal for both datasets.