## Chart: Accuracy vs. DTR for AIME 25 and GPQA-D
### Overview
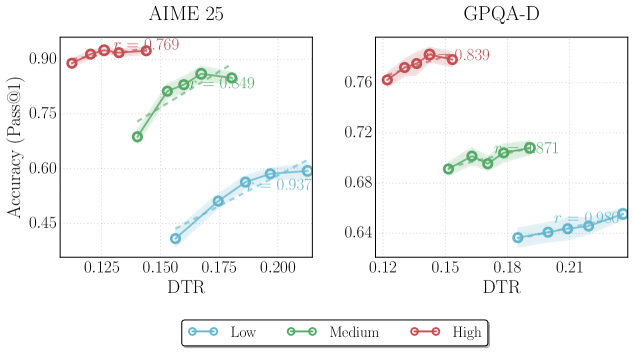
The image presents two line charts comparing the relationship between Accuracy (Pass@1) and DTR (Decoding-Time Ratio) for two datasets: AIME 25 and GPQA-D. Each chart displays three lines representing different levels of complexity: Low, Medium, and High. The charts aim to demonstrate how accuracy changes with varying decoding times for each dataset and complexity level.
### Components/Axes
* **X-axis:** DTR (Decoding-Time Ratio). Scale ranges from approximately 0.125 to 0.21.
* **Y-axis:** Accuracy (Pass@1). Scale ranges from approximately 0.4 to 0.95.
* **Datasets:** AIME 25 (left chart), GPQA-D (right chart).
* **Complexity Levels (Legend):**
* Low (Light Blue, dashed line with circle markers)
* Medium (Green, dashed line with circle markers)
* High (Red, dashed line with circle markers)
* **Legend Position:** Bottom-center of the image.
### Detailed Analysis or Content Details
**AIME 25 (Left Chart)**
* **High (Red):** The line slopes downward slightly, starting at approximately 0.91 at DTR 0.125 and ending at approximately 0.88 at DTR 0.20. A value of approximately 0.769 is annotated near DTR 0.15.
* **Medium (Green):** The line shows an upward trend, starting at approximately 0.74 at DTR 0.125 and reaching approximately 0.84 at DTR 0.20. A value of approximately 0.849 is annotated near DTR 0.175.
* **Low (Light Blue):** The line exhibits an upward trend, starting at approximately 0.48 at DTR 0.125 and reaching approximately 0.60 at DTR 0.20. A value of approximately 0.937 is annotated near DTR 0.175.
**GPQA-D (Right Chart)**
* **High (Red):** The line slopes downward, starting at approximately 0.77 at DTR 0.12 and ending at approximately 0.74 at DTR 0.21. A value of approximately 0.839 is annotated near DTR 0.15.
* **Medium (Green):** The line shows an upward trend, starting at approximately 0.69 at DTR 0.12 and reaching approximately 0.72 at DTR 0.21. A value of approximately 0.871 is annotated near DTR 0.18.
* **Low (Light Blue):** The line exhibits a relatively flat trend, starting at approximately 0.65 at DTR 0.12 and ending at approximately 0.66 at DTR 0.21. A value of approximately 0.936 is annotated near DTR 0.18.
### Key Observations
* In both datasets, the "High" complexity level consistently demonstrates the highest accuracy at lower DTR values.
* As DTR increases, the accuracy of the "High" complexity level tends to decrease more rapidly than the other levels.
* The "Low" complexity level shows a more gradual increase in accuracy with increasing DTR, and in the GPQA-D dataset, it remains relatively flat.
* The annotated values appear to be peak accuracy points for each complexity level within each dataset.
### Interpretation
The charts suggest a trade-off between accuracy and decoding time. Higher complexity models (represented by the "High" line) achieve higher accuracy initially but experience a more significant drop in accuracy as decoding time increases. Lower complexity models (represented by the "Low" line) have lower initial accuracy but are more robust to increases in decoding time. The "Medium" complexity level offers a balance between these two extremes.
The differences between AIME 25 and GPQA-D indicate that the optimal complexity level and DTR may vary depending on the specific dataset. The annotated values likely represent points where the models achieve a good balance between accuracy and decoding speed for each complexity level. The relatively flat "Low" line in GPQA-D suggests that increasing decoding time does not significantly improve accuracy for this dataset at the lowest complexity level. This could indicate that the dataset is relatively simple or that the low-complexity model has already reached its performance limit.