TECHNICAL ASSET FINGERPRINT
f1beaea00115f0eed15d8918
Click to view fullscreen
Press ESC or click to close
FOUND IN PAPERS
EXPERT: healer-alpha-free VERSION 1
RUNTIME: free/openrouter/healer-alpha
INTEL_VERIFIED
## Scatter Plot with Trend Lines: AIME 25 and GPQA-D Accuracy vs. DTR
### Overview
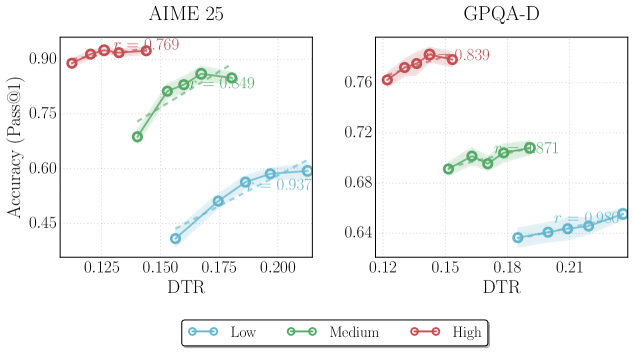
The image displays two side-by-side scatter plots with overlaid trend lines, comparing model accuracy (Pass@1) against a metric labeled "DTR" for two different datasets or tasks: "AIME 25" (left) and "GPQA-D" (right). Each plot contains three data series, categorized by difficulty level (Low, Medium, High), distinguished by color. The plots show a positive correlation between DTR and accuracy for each series, with varying strengths.
### Components/Axes
* **Titles:**
* Left Chart: "AIME 25" (centered at the top).
* Right Chart: "GPQA-D" (centered at the top).
* **Y-Axis (Both Charts):** Labeled "Accuracy (Pass@1)". The scale is linear.
* AIME 25 Range: Approximately 0.40 to 0.95. Major tick marks at 0.45, 0.60, 0.75, 0.90.
* GPQA-D Range: Approximately 0.62 to 0.78. Major tick marks at 0.64, 0.68, 0.72, 0.76.
* **X-Axis (Both Charts):** Labeled "DTR". The scale is linear.
* AIME 25 Range: Approximately 0.11 to 0.21. Major tick marks at 0.125, 0.150, 0.175, 0.200.
* GPQA-D Range: Approximately 0.11 to 0.22. Major tick marks at 0.12, 0.15, 0.18, 0.21.
* **Legend:** Positioned at the bottom center of the entire figure, below both charts.
* **Low:** Blue line with circle markers.
* **Medium:** Green line with circle markers.
* **High:** Red line with circle markers.
* **Data Series & Trend Lines:** Each series consists of individual data points (circles) and a dashed trend line with a shaded confidence interval. A Pearson correlation coefficient (`r`) is displayed near each trend line.
### Detailed Analysis
#### **AIME 25 Chart (Left)**
* **High (Red) Series:**
* **Placement:** Top-left quadrant of the chart.
* **Trend:** Strong positive slope. Points cluster tightly around the trend line.
* **Data Range:** DTR from ~0.115 to ~0.140. Accuracy from ~0.89 to ~0.93.
* **Correlation:** `r = 0.769` (displayed in red text near the series).
* **Medium (Green) Series:**
* **Placement:** Center of the chart, spanning from lower-left to upper-right.
* **Trend:** Positive slope, less steep than the High series.
* **Data Range:** DTR from ~0.140 to ~0.185. Accuracy from ~0.68 to ~0.85.
* **Correlation:** `r = 0.949` (displayed in green text near the series).
* **Low (Blue) Series:**
* **Placement:** Bottom-right quadrant of the chart.
* **Trend:** Positive slope, similar steepness to the Medium series.
* **Data Range:** DTR from ~0.155 to ~0.205. Accuracy from ~0.40 to ~0.60.
* **Correlation:** `r = 0.937` (displayed in blue text near the series).
#### **GPQA-D Chart (Right)**
* **High (Red) Series:**
* **Placement:** Top-left quadrant of the chart.
* **Trend:** Positive slope.
* **Data Range:** DTR from ~0.120 to ~0.145. Accuracy from ~0.76 to ~0.78.
* **Correlation:** `r = 0.839` (displayed in red text near the series).
* **Medium (Green) Series:**
* **Placement:** Center of the chart.
* **Trend:** Positive slope.
* **Data Range:** DTR from ~0.150 to ~0.190. Accuracy from ~0.69 to ~0.71.
* **Correlation:** `r = 0.871` (displayed in green text near the series).
* **Low (Blue) Series:**
* **Placement:** Bottom-right quadrant of the chart.
* **Trend:** Positive slope.
* **Data Range:** DTR from ~0.185 to ~0.220. Accuracy from ~0.64 to ~0.65.
* **Correlation:** `r = 0.981` (displayed in blue text near the series).
### Key Observations
1. **Consistent Positive Correlation:** For both datasets (AIME 25 and GPQA-D) and across all difficulty levels (Low, Medium, High), accuracy increases as DTR increases. All correlation coefficients (`r`) are positive and strong (ranging from 0.769 to 0.981).
2. **Difficulty Stratification:** There is a clear vertical separation by difficulty. For any given DTR value, the "High" difficulty series has the highest accuracy, followed by "Medium," then "Low." This ordering is perfectly maintained in both charts.
3. **DTR Range by Difficulty:** There is a clear horizontal separation by difficulty. The "High" difficulty series operates at the lowest DTR values, "Medium" in the middle, and "Low" at the highest DTR values. This suggests DTR might be inversely related to task difficulty.
4. **Dataset Comparison:** The AIME 25 dataset shows a much wider range of accuracy values (approx. 0.40-0.93) compared to GPQA-D (approx. 0.64-0.78). The slopes of the trend lines also appear steeper in the AIME 25 plot.
5. **Correlation Strength:** The "Low" difficulty series shows the strongest correlation in both datasets (`r=0.937` for AIME 25, `r=0.981` for GPQA-D).
### Interpretation
The data demonstrates a robust, positive relationship between the DTR metric and model accuracy (Pass@1) across two distinct benchmarks. The consistent stratification by difficulty level is the most salient finding.
* **What the data suggests:** Higher DTR values are associated with better performance. However, the tasks where the model achieves high accuracy (the "High" difficulty series) are inherently associated with *lower* DTR values. This presents an interesting paradox: the model performs best on hard tasks, but those hard tasks are characterized by low DTR. This could imply that DTR measures something like "data transformation rate" or "difficulty transformation ratio," where a lower value indicates a more challenging, less transformed, or more "raw" problem setup that the model is surprisingly adept at solving.
* **Relationship between elements:** The three difficulty tiers form parallel, non-overlapping bands across the DTR-accuracy space. This indicates that difficulty level is a primary confounding variable; analyzing the effect of DTR on accuracy without controlling for difficulty would be misleading. The strong correlations within each band show that DTR is still a meaningful predictor of performance *within* a given difficulty class.
* **Notable Anomalies/Trends:** The perfect ordering of difficulty bands and their distinct DTR ranges is striking. It suggests the "DTR" metric is intrinsically linked to the problem difficulty definition used for these benchmarks. The near-perfect correlation (`r=0.981`) for the Low/GPQA-D series indicates an almost linear relationship in that specific regime. The wider accuracy spread in AIME 25 might indicate it is a more discriminating benchmark or that the model's performance is more variable on its problem set.
DECODING INTELLIGENCE...