## Line Charts: AIME 25 and GPQA-D Performance Analysis
### Overview
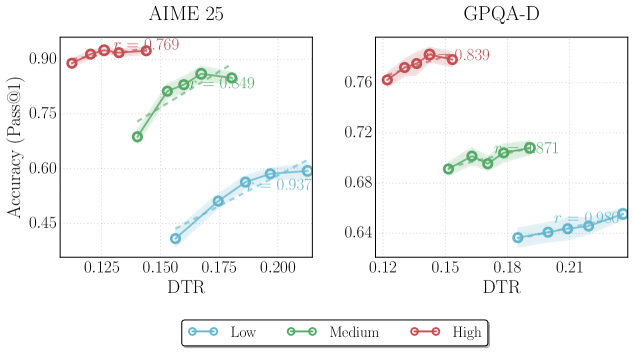
The image contains two side-by-side line charts comparing accuracy (Pass@1) against DTR (Dynamic Task Rate) for three difficulty levels: Low, Medium, and High. Each chart represents a different evaluation framework ("AIME 25" and "GPQA-D"). The charts use color-coded lines with correlation coefficients (r-values) indicating relationships between DTR and accuracy.
### Components/Axes
- **Y-Axis**: Accuracy (Pass@1) ranging from 0.45 to 0.90 (AIME 25) and 0.64 to 0.76 (GPQA-D).
- **X-Axis**: DTR (Dynamic Task Rate) ranging from 0.125 to 0.200 (AIME 25) and 0.12 to 0.21 (GPQA-D).
- **Legend**: Located at the bottom, with:
- **Blue**: Low difficulty
- **Green**: Medium difficulty
- **Red**: High difficulty
- **Correlation Coefficients (r)**:
- AIME 25: High (0.769), Medium (0.849), Low (0.937)
- GPQA-D: High (0.839), Medium (0.871), Low (0.980)
### Detailed Analysis
#### AIME 25 Chart
- **High Difficulty (Red)**:
- Accuracy starts at ~0.90 (DTR=0.125) and decreases slightly to ~0.89 (DTR=0.200).
- Correlation (r=0.769) indicates a moderate positive relationship.
- **Medium Difficulty (Green)**:
- Accuracy rises from ~0.70 (DTR=0.15) to ~0.75 (DTR=0.175).
- Correlation (r=0.849) suggests a stronger linear relationship.
- **Low Difficulty (Blue)**:
- Accuracy increases from ~0.45 (DTR=0.125) to ~0.60 (DTR=0.200).
- Correlation (r=0.937) shows the strongest linear trend.
#### GPQA-D Chart
- **High Difficulty (Red)**:
- Accuracy remains stable (~0.76 at DTR=0.12 to ~0.76 at DTR=0.21).
- Correlation (r=0.839) indicates a moderate relationship.
- **Medium Difficulty (Green)**:
- Accuracy fluctuates between ~0.68 (DTR=0.15) and ~0.72 (DTR=0.18).
- Correlation (r=0.871) reflects a slightly stronger trend than High difficulty.
- **Low Difficulty (Blue)**:
- Accuracy rises from ~0.64 (DTR=0.12) to ~0.68 (DTR=0.21).
- Correlation (r=0.980) demonstrates the strongest linear dependency.
### Key Observations
1. **Difficulty-Accuracy Tradeoff**:
- High difficulty consistently achieves the highest accuracy but shows the weakest correlation with DTR.
- Low difficulty has the lowest accuracy but the strongest correlation with DTR.
2. **Trend Variability**:
- High difficulty lines are relatively flat, suggesting robustness to DTR changes.
- Low difficulty lines exhibit steep slopes, indicating sensitivity to DTR adjustments.
3. **Framework Differences**:
- GPQA-D generally shows higher accuracy across all difficulty levels compared to AIME 25.
- GPQA-D's Low difficulty line has the highest r-value (0.980), suggesting near-perfect linear alignment.
### Interpretation
The data reveals a critical insight: **higher difficulty tasks prioritize accuracy over adaptability**, maintaining performance despite DTR variations (low r-values). Conversely, **lower difficulty tasks are more adaptive** to DTR changes but struggle with baseline accuracy. This suggests that evaluation frameworks like AIME 25 and GPQA-D may emphasize different aspects of task performance—robustness vs. sensitivity. The near-perfect correlation (r=0.980) in GPQA-D's Low difficulty line implies that DTR adjustments could be a reliable lever for tuning performance in simpler tasks, whereas harder tasks require alternative optimization strategies.