\n
## Diagram: Reaction Pathway Illustration
### Overview
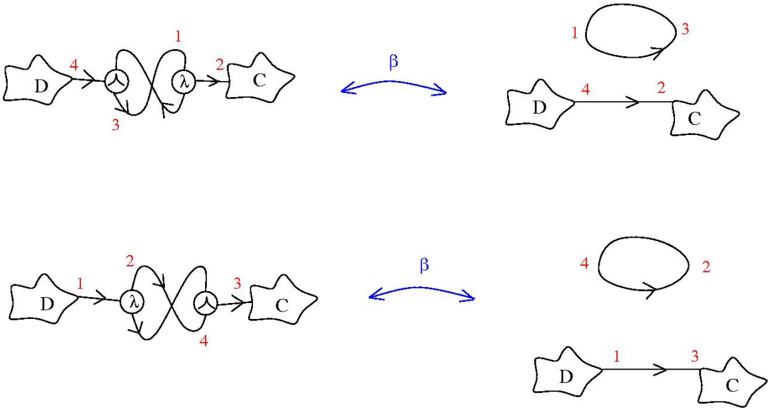
The image presents a series of diagrams illustrating a chemical reaction pathway. The diagrams depict molecules (labeled D and C) and a transition state (labeled λ). Arrows indicate the flow of the reaction, and numbers are used to label specific steps or bonds. A double-headed arrow labeled "β" connects pairs of diagrams, suggesting an equilibrium or reversible process.
### Components/Axes
The diagrams consist of the following components:
* **Molecules:** Represented by stylized shapes, labeled "D" and "C".
* **Transition State:** Represented by a double-X shape, labeled "λ".
* **Arrows:** Indicate the direction of the reaction.
* **Numbers:** Used to label bonds or steps in the reaction (1, 2, 3, 4).
* **Double-Headed Arrow:** Labeled "β", indicating a reversible process or equilibrium.
### Detailed Analysis or Content Details
The image contains four distinct diagrams, arranged in two pairs connected by the "β" arrow.
**Top Pair:**
* **Left Diagram:** Molecule D (labeled 4) reacts with the transition state λ (labeled 1 and 3), which then leads to molecule C (labeled 2).
* **Right Diagram:** A loop is formed from molecule D (labeled 1 and 3). Molecule D (labeled 4) reacts to form molecule C (labeled 2).
**Bottom Pair:**
* **Left Diagram:** Molecule D (labeled 1) reacts with the transition state λ (labeled 2 and 4), which then leads to molecule C (labeled 3).
* **Right Diagram:** A loop is formed from molecule C (labeled 2 and 4). Molecule D (labeled 1) reacts to form molecule C (labeled 3).
### Key Observations
The diagrams illustrate two different reaction pathways, each with a reversible step represented by the "β" arrow. The numbers associated with the arrows and molecules suggest changes in bond formation or breaking during the reaction. The transition state (λ) appears to be a key intermediate in both pathways. The diagrams show a possible interconversion between the two pathways.
### Interpretation
The diagrams likely represent a simplified model of a chemical reaction involving molecules D and C, with a transition state λ. The "β" arrow suggests that the reaction is reversible or that there is an equilibrium between the two pathways. The numbers likely represent specific bonds or interactions that are formed or broken during the reaction. The diagrams could be used to illustrate the mechanism of a chemical reaction, or to compare the relative rates of different pathways. The loops in the right diagrams suggest self-catalysis or internal rearrangement within the molecules. The diagrams are schematic and do not provide quantitative data, but they offer a qualitative understanding of the reaction process. The image does not provide any facts or data, but rather a visual representation of a theoretical process.