## Fishbone Diagram: Challenges in Implementing Interpretable AI Systems
### Overview
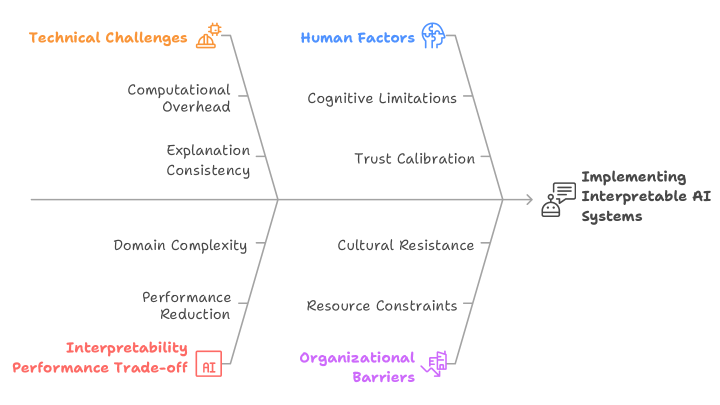
The image is a fishbone (Ishikawa) diagram illustrating the multifaceted challenges associated with "Implementing Interpretable AI Systems." The diagram organizes these challenges into four primary categories, each branching off a central spine that points to the main effect or goal. The visual style is clean and schematic, using color-coding and icons to differentiate the categories.
### Components/Axes
* **Central Spine & Effect:** A horizontal line runs from left to right, terminating in an arrow pointing to the main subject: **"Implementing Interpretable AI Systems"**. This text is accompanied by a small icon depicting a person at a computer with a document.
* **Primary Categories (Bones):** Four main branches connect to the central spine. Each is labeled with a category title, a distinct color, and a small thematic icon.
1. **Top-Left Branch (Orange):** Labeled **"Technical Challenges"** with a gear/cog icon.
2. **Top-Right Branch (Blue):** Labeled **"Human Factors"** with a head/brain icon.
3. **Bottom-Left Branch (Red):** Labeled **"Interpretability Performance Trade-off"** with an "AI" icon inside a box.
4. **Bottom-Right Branch (Purple):** Labeled **"Organizational Barriers"** with an icon of a building or organization chart.
* **Sub-Factors (Smaller Bones):** Each primary category has two specific challenges listed as text along its branch.
### Detailed Analysis
**1. Technical Challenges (Orange, Top-Left):**
* **Sub-factor 1:** "Computational Overhead"
* **Sub-factor 2:** "Explanation Consistency"
**2. Human Factors (Blue, Top-Right):**
* **Sub-factor 1:** "Cognitive Limitations"
* **Sub-factor 2:** "Trust Calibration"
**3. Interpretability Performance Trade-off (Red, Bottom-Left):**
* **Sub-factor 1:** "Domain Complexity"
* **Sub-factor 2:** "Performance Reduction"
**4. Organizational Barriers (Purple, Bottom-Right):**
* **Sub-factor 1:** "Cultural Resistance"
* **Sub-factor 2:** "Resource Constraints"
### Key Observations
* The diagram presents a balanced view, attributing challenges equally to technical, human, performance, and organizational domains.
* The challenges are framed as inherent tensions or obstacles (e.g., "Trade-off," "Barriers," "Limitations," "Constraints").
* The use of color and icons provides immediate visual categorization, separating the types of challenges.
* The flow is logical: the four categories of challenges (the "causes" in fishbone terminology) all feed into the central problem or effect of implementing interpretable AI.
### Interpretation
This diagram argues that the difficulty of deploying interpretable AI is not a singular technical problem but a systemic one. It suggests that success requires navigating a complex web of interconnected issues:
* **Technical vs. Human:** Even if a technically consistent and computationally feasible explanation is generated (addressing *Technical Challenges*), it must still align with human cognitive limits and foster appropriate trust (addressing *Human Factors*).
* **Performance vs. Interpretability:** The core trade-off is highlighted, where seeking interpretability may be constrained by the complexity of the domain and could lead to a reduction in raw model performance.
* **Individual vs. Organizational:** Beyond the model and its users, broader organizational culture and resource allocation (*Organizational Barriers*) are critical, often-overlooked factors that can determine adoption.
The diagram serves as a diagnostic tool or a checklist for stakeholders. It implies that a holistic strategy—considering engineering, human-computer interaction, model validation, and change management—is essential for the successful implementation of interpretable AI systems. The absence of numerical data indicates this is a conceptual framework for identifying problem areas rather than a quantitative analysis.