\n
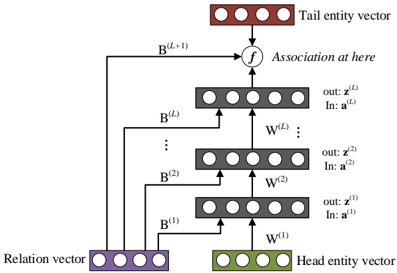
## Diagram: Multi-Layered Neural Network for Knowledge Representation
### Overview
The image depicts a multi-layered neural network diagram used for representing knowledge, specifically focusing on relationships between entities. The diagram illustrates a series of layers processing input vectors (relation and entities) to generate an association. The network appears to be designed for learning and representing complex relationships.
### Components/Axes
The diagram consists of the following components:
* **Relation vector:** Represented by a row of purple circles at the bottom-left.
* **Head entity vector:** Represented by a row of green circles at the bottom-right.
* **Tail entity vector:** Represented by a row of brown circles at the top.
* **Layers:** Multiple layers (at least three are fully visible, with an indication of more) of grey circles, each representing a layer of processing. Each layer has an input ("In: a<sup>(l)</sup>") and an output ("out: z<sup>(l)</sup>").
* **Weights:** Each layer is associated with a weight matrix, denoted as W<sup>(l)</sup>.
* **Association Function:** A circular node labeled "f" representing the association function, positioned between the top layer and the tail entity vector.
* **Bias Vectors:** Represented by B<sup>(l)</sup>, connecting the relation vector to each layer.
* **Text Annotations:** Labels indicating input, output, weights, and the association function.
### Detailed Analysis or Content Details
The diagram shows a flow of information from the relation and head entity vectors through multiple layers to the tail entity vector.
1. **Input Layer:** The relation vector (purple) and head entity vector (green) are the initial inputs.
2. **Layer 1:** The relation vector and head entity vector are processed through W<sup>(1)</sup>, resulting in an output z<sup>(1)</sup>. A bias vector B<sup>(1)</sup> is added.
3. **Layer 2:** The output z<sup>(1)</sup> and the relation vector are processed through W<sup>(2)</sup>, resulting in an output z<sup>(2)</sup>. A bias vector B<sup>(2)</sup> is added.
4. **Layer l:** This pattern continues for an unspecified number of layers (indicated by the "...") up to layer l. The output z<sup>(l)</sup> and the relation vector are processed through W<sup>(l)</sup>, resulting in an output z<sup>(l)</sup>. A bias vector B<sup>(l)</sup> is added.
5. **Final Layer:** The output of the final layer is combined with the tail entity vector (brown) through the association function "f".
6. **Association:** The association function "f" produces the final output, representing the relationship between the head and tail entities given the relation.
The diagram does not provide specific numerical values for the vectors, weights, or outputs. It is a conceptual representation of the network architecture.
### Key Observations
* The network uses multiple layers to progressively refine the representation of the relationship.
* The relation vector is used as input to each layer, suggesting it plays a crucial role in shaping the relationship representation.
* The bias vectors (B<sup>(l)</sup>) are added to each layer, allowing the network to learn offsets and adjust the activation thresholds.
* The association function "f" is a key component, responsible for combining the processed information with the tail entity vector to generate the final association.
### Interpretation
This diagram illustrates a neural network architecture designed to learn and represent relationships between entities. The multi-layered structure allows the network to capture complex dependencies and nuances in the relationships. The use of weights (W<sup>(l)</sup>) and bias vectors (B<sup>(l)</sup>) enables the network to learn from data and adapt its representation of the relationships. The association function "f" serves as a final step to integrate the learned representation with the tail entity, effectively predicting or inferring the relationship.
The diagram suggests a knowledge representation approach where relationships are not explicitly defined but rather learned from data through the network's training process. This is a common approach in areas like knowledge graph completion and relation extraction. The diagram is a high-level conceptual overview and does not provide details about the specific activation functions, loss functions, or training algorithms used. It is a visual representation of a computational model for reasoning about relationships.