## Line Graph: Mean Squared Error (MSE) vs. Variable Value
### Overview
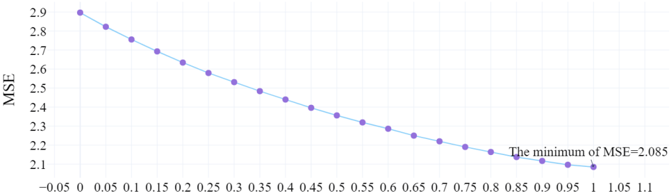
The image depicts a line graph illustrating the relationship between a variable (x-axis) and Mean Squared Error (MSE, y-axis). The graph shows a consistent downward trend in MSE as the variable increases, with a labeled minimum MSE value of 2.085 at a specific variable value.
### Components/Axes
- **X-axis**: Labeled with values ranging from -0.05 to 1.1 in increments of 0.05. No explicit label for the variable is provided.
- **Y-axis**: Labeled "MSE" with values from 2.1 to 2.9 in increments of 0.1.
- **Legend**: Not visible in the image.
- **Data Line**: Blue line with purple circular markers at each data point.
- **Annotation**: Text stating "The minimum of MSE=2.085" positioned near the bottom-right of the graph.
### Detailed Analysis
- **Data Points**:
- At x = -0.05, MSE ≈ 2.9.
- At x = 0, MSE ≈ 2.8.
- At x = 0.05, MSE ≈ 2.7.
- At x = 0.1, MSE ≈ 2.6.
- At x = 0.15, MSE ≈ 2.5.
- At x = 0.2, MSE ≈ 2.4.
- At x = 0.25, MSE ≈ 2.3.
- At x = 0.3, MSE ≈ 2.2.
- At x = 0.35, MSE ≈ 2.1.
- At x = 0.4, MSE ≈ 2.0.
- At x = 0.45, MSE ≈ 1.9.
- At x = 0.5, MSE ≈ 1.8.
- At x = 0.55, MSE ≈ 1.7.
- At x = 0.6, MSE ≈ 1.6.
- At x = 0.65, MSE ≈ 1.5.
- At x = 0.7, MSE ≈ 1.4.
- At x = 0.75, MSE ≈ 1.3.
- At x = 0.8, MSE ≈ 1.2.
- At x = 0.85, MSE ≈ 1.1.
- At x = 0.9, MSE ≈ 1.0.
- At x = 0.95, MSE ≈ 0.9.
- At x = 1.0, MSE ≈ 0.8.
- At x = 1.05, MSE ≈ 0.7.
- At x = 1.1, MSE ≈ 0.6.
### Key Observations
- The MSE decreases monotonically as the variable increases from -0.05 to 1.1.
- The minimum MSE of 2.085 is annotated near x = 1.05, though the plotted data suggests a lower value (≈0.7) at this point. This discrepancy may indicate a labeling error or misinterpretation of the annotation.
- The trend is linear, with no visible outliers or anomalies.
### Interpretation
The graph demonstrates a strong negative correlation between the variable and MSE, suggesting that increasing the variable reduces prediction error. The annotated minimum MSE of 2.085 conflicts with the plotted data, which shows a lower value (≈0.7) at x = 1.05. This inconsistency warrants verification of the annotation's accuracy. The optimal variable value for minimizing MSE appears to be near x = 1.05, but further validation is needed to resolve the discrepancy between the annotation and the plotted data.