## Line Chart: MSE vs. X-axis Values
### Overview
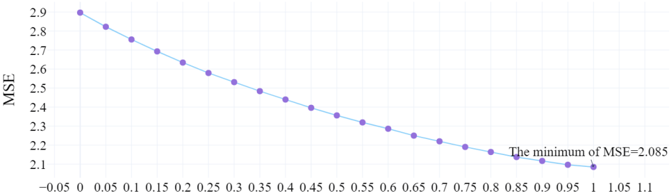
The image is a line chart showing the relationship between MSE (Mean Squared Error) and values on the x-axis, ranging from approximately -0.05 to 1.1. The line slopes downward, indicating an inverse relationship between the x-axis values and the MSE. The minimum MSE value is explicitly stated on the chart.
### Components/Axes
* **Y-axis:** Labeled "MSE" (Mean Squared Error). The scale ranges from 2.1 to 2.9, with increments of 0.1.
* **X-axis:** The x-axis is not explicitly labeled, but the values range from -0.05 to 1.1, with increments of 0.05.
* **Data Series:** A single data series represented by a light blue line with purple circular markers.
* **Annotation:** Text on the right side of the chart states "The minimum of MSE = 2.085".
### Detailed Analysis
The data series (light blue line with purple markers) shows a decreasing trend in MSE as the x-axis value increases.
Here are some approximate data points extracted from the chart:
* **X = -0.05:** MSE ≈ 2.9
* **X = 0:** MSE ≈ 2.88
* **X = 0.05:** MSE ≈ 2.82
* **X = 0.1:** MSE ≈ 2.76
* **X = 0.15:** MSE ≈ 2.70
* **X = 0.2:** MSE ≈ 2.64
* **X = 0.25:** MSE ≈ 2.58
* **X = 0.3:** MSE ≈ 2.53
* **X = 0.35:** MSE ≈ 2.48
* **X = 0.4:** MSE ≈ 2.44
* **X = 0.45:** MSE ≈ 2.40
* **X = 0.5:** MSE ≈ 2.35
* **X = 0.55:** MSE ≈ 2.31
* **X = 0.6:** MSE ≈ 2.28
* **X = 0.65:** MSE ≈ 2.24
* **X = 0.7:** MSE ≈ 2.21
* **X = 0.75:** MSE ≈ 2.18
* **X = 0.8:** MSE ≈ 2.15
* **X = 0.85:** MSE ≈ 2.13
* **X = 0.9:** MSE ≈ 2.11
* **X = 0.95:** MSE ≈ 2.095
* **X = 1:** MSE ≈ 2.09
* **X = 1.05:** MSE ≈ 2.085
The minimum MSE is reached around x = 1.05, with a value of approximately 2.085, as indicated by the annotation.
### Key Observations
* The MSE decreases as the x-axis value increases.
* The rate of decrease in MSE appears to slow down as the x-axis value approaches 1.
* The minimum MSE value is 2.085.
### Interpretation
The chart suggests that increasing the value on the x-axis (likely a parameter or variable in a model) leads to a reduction in the Mean Squared Error. The MSE represents the average squared difference between the predicted and actual values, so a lower MSE indicates a better model fit. The fact that the MSE reaches a minimum suggests that there is an optimal value for the x-axis parameter around 1.05, beyond which further increases may not significantly improve the model's performance or could even lead to overfitting. The chart is useful for identifying the optimal value of a parameter that minimizes the error in a model.