\n
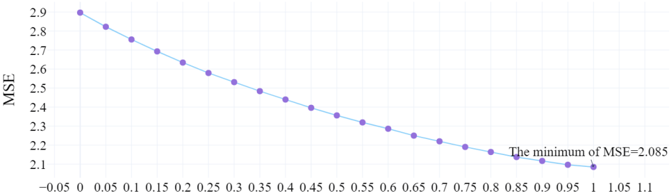
## Chart: MSE vs. Parameter Value
### Overview
The image presents a line chart illustrating the relationship between Mean Squared Error (MSE) and a parameter value, ranging from approximately -0.05 to 1.1. The chart shows a decreasing trend, indicating that as the parameter value increases, the MSE generally decreases. A minimum MSE value is highlighted.
### Components/Axes
* **X-axis:** Labeled "Parameter Value", ranging from -0.05 to 1.1, with increments of 0.05.
* **Y-axis:** Labeled "MSE", ranging from 2.1 to 2.9, with increments of 0.1.
* **Data Series:** A single line plot represented by purple circles connected by a light blue line.
* **Annotation:** Text label "The minimum of MSE=2.085" pointing to a data point.
### Detailed Analysis
The line plot demonstrates a clear downward trend. The MSE value starts at approximately 2.9 when the parameter value is -0.05. As the parameter value increases, the MSE decreases. Here's a breakdown of approximate data points:
* Parameter Value = 0.05, MSE ≈ 2.85
* Parameter Value = 0.15, MSE ≈ 2.7
* Parameter Value = 0.25, MSE ≈ 2.6
* Parameter Value = 0.35, MSE ≈ 2.5
* Parameter Value = 0.45, MSE ≈ 2.4
* Parameter Value = 0.55, MSE ≈ 2.3
* Parameter Value = 0.65, MSE ≈ 2.25
* Parameter Value = 0.75, MSE ≈ 2.2
* Parameter Value = 0.85, MSE ≈ 2.15
* Parameter Value = 0.95, MSE ≈ 2.12
* Parameter Value = 1.05, MSE ≈ 2.085 (minimum)
* Parameter Value = 1.1, MSE ≈ 2.05
The minimum MSE value is explicitly stated as 2.085, occurring at a parameter value of approximately 1.05.
### Key Observations
* The MSE decreases rapidly initially, then the rate of decrease slows down as the parameter value approaches 1.05.
* The minimum MSE is reached at a parameter value of approximately 1.05.
* The data suggests a potential optimal parameter value around 1.05, where the model achieves the lowest error.
### Interpretation
This chart likely represents the performance of a model or algorithm as a function of a specific parameter. The MSE is a common metric for evaluating the accuracy of a model, with lower values indicating better performance. The decreasing trend suggests that adjusting the parameter value in the observed range improves the model's accuracy. The identified minimum MSE value indicates an optimal parameter setting.
The chart demonstrates a clear relationship between the parameter and the model's performance. It suggests that the parameter has a significant impact on the model's accuracy, and finding the optimal parameter value (around 1.05 in this case) is crucial for achieving the best possible results. The flattening of the curve near the minimum suggests diminishing returns from further increasing the parameter value beyond 1.05. This could indicate that the model has reached a point of optimal performance and further adjustments would not yield significant improvements.