### Technical Document Extraction: Comparison of Data Processing Patterns
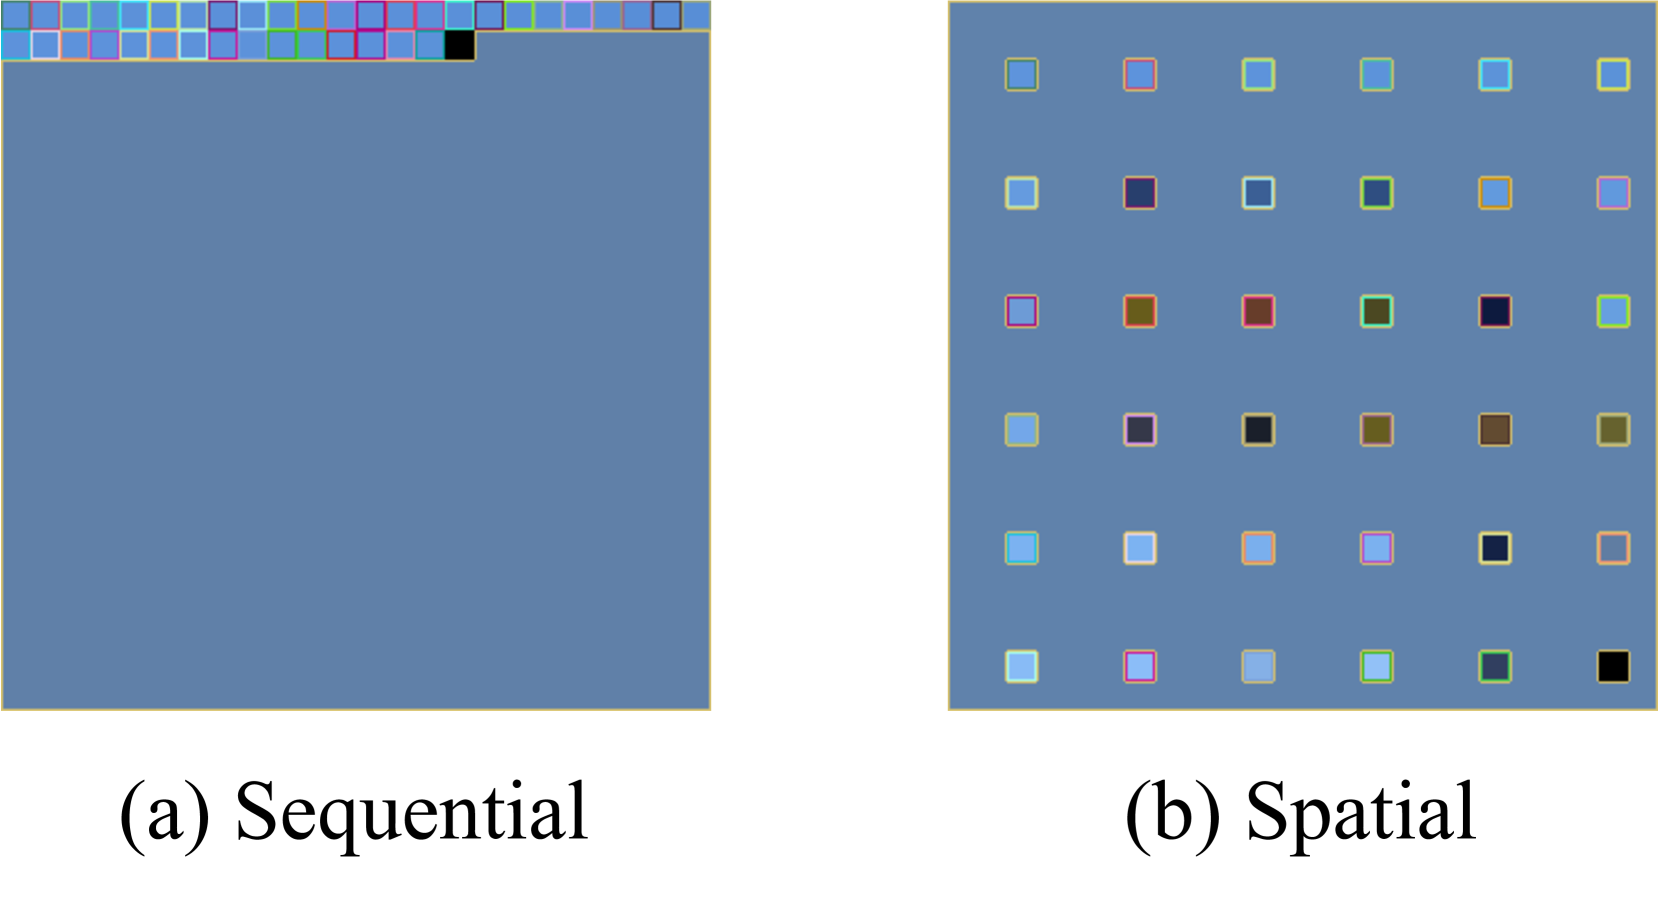
This image illustrates two distinct methods of organizing or processing data units within a defined space, likely representing memory allocation, pixel processing, or task scheduling.
#### 1. Image Structure and Labels
The image is divided into two primary panels, labeled at the bottom:
* **Left Panel (a):** Sequential
* **Right Panel (b):** Spatial
#### 2. Component Analysis
**Common Elements:**
* **Background:** Both panels feature a solid blue-grey square background.
* **Data Units:** Represented by small, multi-colored squares. Each square has a distinct inner fill color and a thin colored border.
* **Total Units:** Each panel contains 36 data units.
**Panel (a) - Sequential:**
* **Spatial Arrangement:** The 36 data units are packed tightly at the top of the frame.
* **Layout Pattern:** They are arranged in a continuous, linear fashion across the top edge.
* **Row 1:** 25 units filling the top-most horizontal line from left to right.
* **Row 2:** 11 units starting from the left, filling approximately 44% of the second horizontal line.
* **Visual Trend:** This represents a "fill-as-you-go" or "stream" approach where data is placed in the next available slot in a 1D sequence, regardless of the 2D space available.
**Panel (b) - Spatial:**
* **Spatial Arrangement:** The 36 data units are distributed evenly across the entire blue-grey square.
* **Layout Pattern:** They are organized into a structured **6x6 grid**.
* **Horizontal Spacing:** Units are separated by consistent gaps of blue-grey background.
* **Vertical Spacing:** Units are separated by consistent gaps of blue-grey background.
* **Visual Trend:** This represents a structured mapping approach where data units are assigned specific coordinates within a 2D field, maintaining spatial relationships and uniform density.
#### 3. Data Unit Color Characteristics
The units in both panels share a similar palette of colors, suggesting they represent the same set of data points or tasks, just organized differently. Colors include:
* Light blue, dark blue, purple, pink, green, yellow-gold, brown, and black.
* In **Panel (a)**, the final unit in the sequence (bottom right of the cluster) is **black**.
* In **Panel (b)**, the final unit in the grid (bottom right corner) is also **black**.
#### 4. Summary of Technical Information
| Feature | (a) Sequential | (b) Spatial |
| :--- | :--- | :--- |
| **Organization** | Linear / Contiguous | Grid-based / Distributed |
| **Grid Dimensions** | N/A (Packed at top) | 6 x 6 |
| **Total Units** | 36 | 36 |
| **Space Utilization** | High density, localized | Low density, uniform coverage |
| **Implied Logic** | Temporal or index-based ordering | Coordinate or location-based mapping |