## Heatmap: Sequential vs Spatial
### Overview
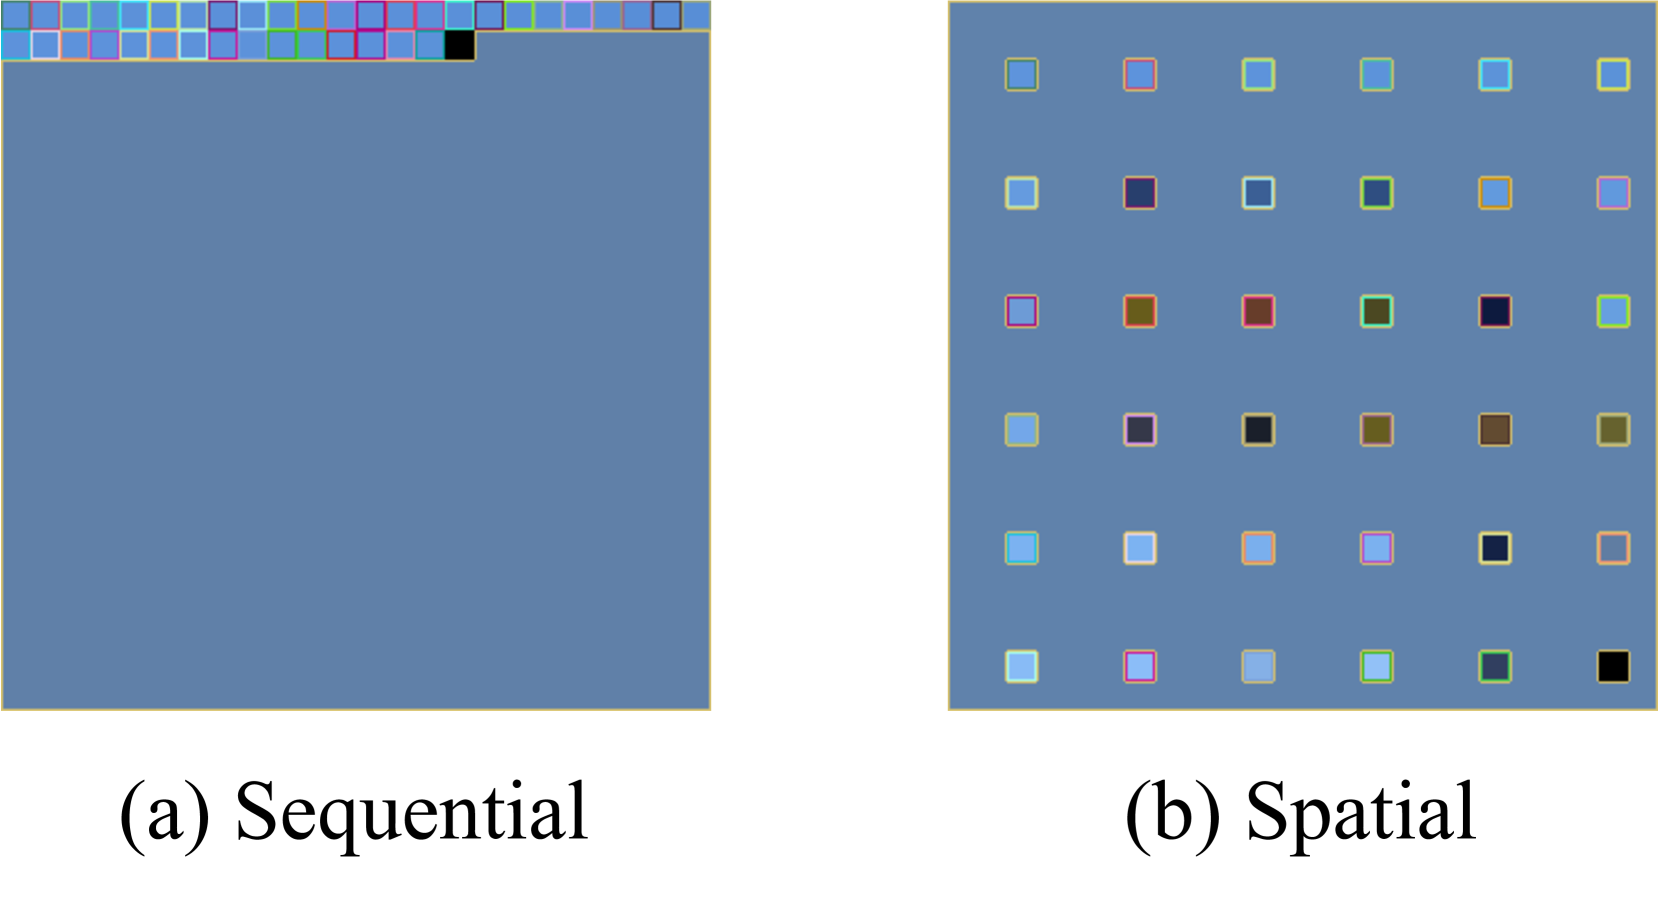
The image displays two heatmaps labeled (a) Sequential and (b) Spatial. Both heatmaps are composed of a grid of squares, each representing a data point. The color of each square corresponds to a value, with darker shades indicating higher values and lighter shades indicating lower values.
### Components/Axes
- **Labels**: The heatmaps are labeled (a) Sequential and (b) Spatial.
- **Axes**: There are no visible axes in the image.
- **Legends**: There are no visible legends in the image.
- **Axis Markers**: There are no visible axis markers in the image.
### Detailed Analysis or ### Content Details
- **Sequential Heatmap (a)**: The squares are arranged in a single row, with each square representing a data point in a sequential manner. The color of each square varies, indicating different values.
- **Spatial Heatmap (b)**: The squares are arranged in a grid pattern, with each square representing a data point in a spatial manner. The color of each square varies, indicating different values.
### Key Observations
- **Sequential Heatmap**: The data points are arranged in a single row, making it easier to see the trend of values from left to right.
- **Spatial Heatmap**: The data points are arranged in a grid pattern, making it easier to see the spatial distribution of values.
### Interpretation
- **Sequential Heatmap**: The data suggests a sequential trend, where the values increase or decrease from left to right.
- **Spatial Heatmap**: The data suggests a spatial distribution of values, where the values are higher or lower in certain areas compared to others.
- **Notable Outliers**: There are no visible outliers in either heatmap.
- **Trends**: The sequential heatmap shows a clear trend of increasing values from left to right.
- **Anomalies**: There are no visible anomalies in either heatmap.