# Technical Document Extraction: Panel Analysis
## Overview
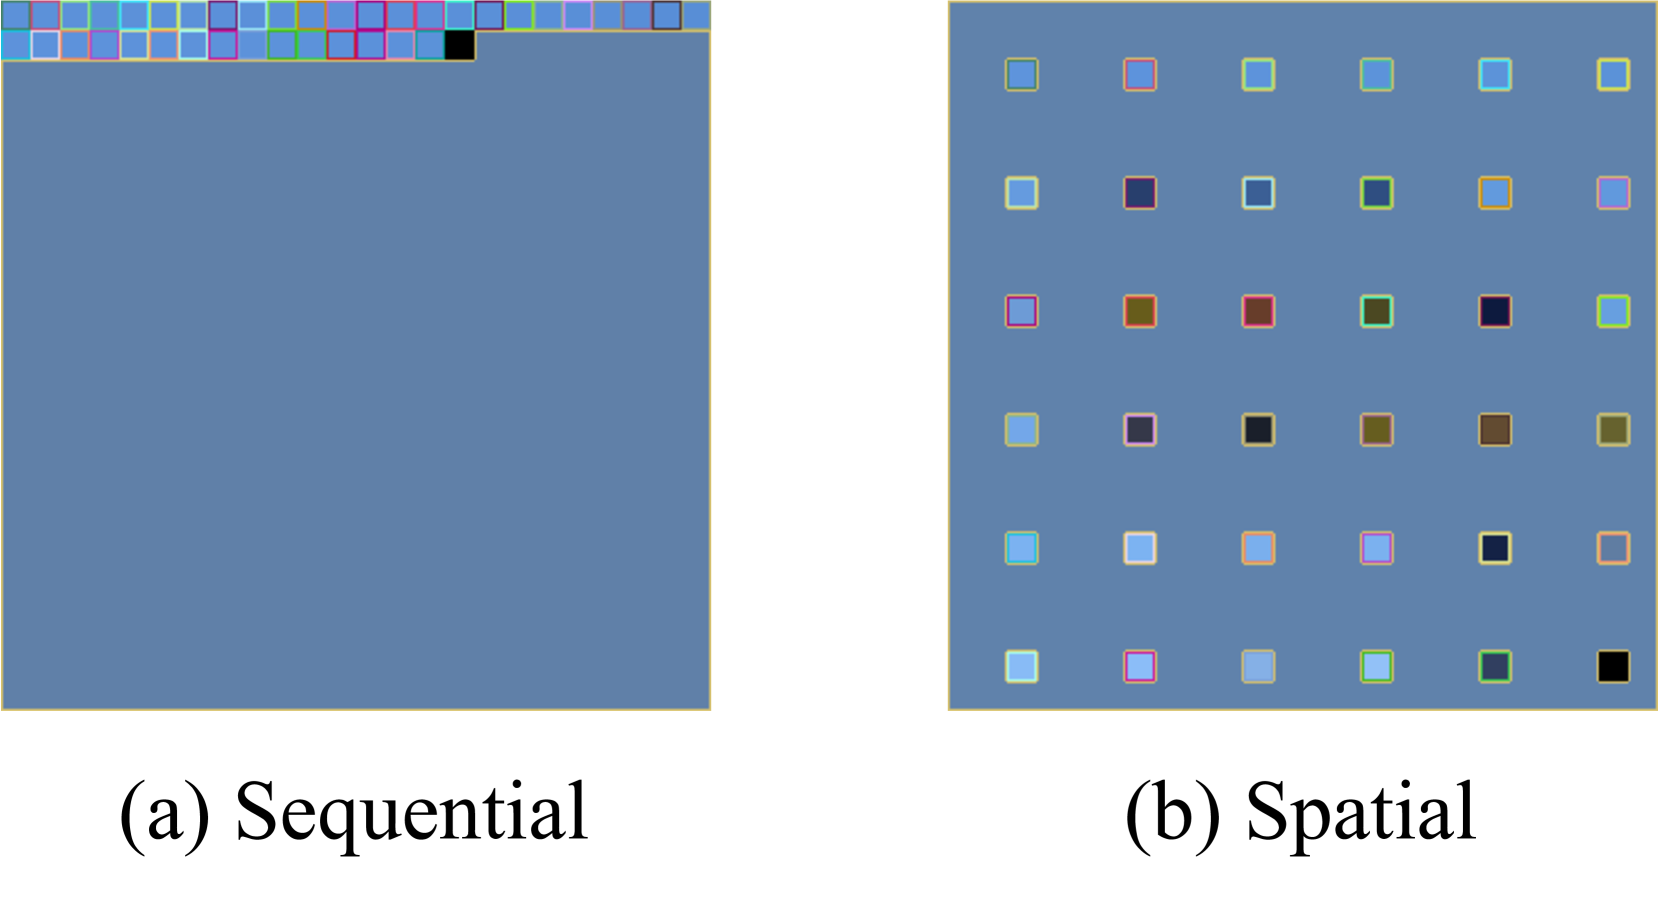
The image contains two side-by-side panels labeled **(a) Sequential** and **(b) Spatial**, each depicting structured grids of colored squares. No numerical data, legends, or textual annotations beyond the panel labels are present. The diagrams appear to represent abstract spatial or sequential arrangements, likely for comparative analysis.
---
### Panel (a): Sequential
- **Structure**:
- A horizontal row of **15 small colored squares** at the top, followed by a large **solid blue area** occupying the majority of the panel.
- Colors in the top row:
- Blue, Purple, Cyan, Yellow, Magenta, Green, Red, Black (repeated in a non-repeating sequence).
- The solid blue area below has no internal divisions or markings.
- **Interpretation**:
- The top row may represent a **sequence of discrete events or states**, with colors encoding categorical distinctions.
- The large blue area could symbolize a **default state**, **background**, or **unassigned region**.
- **Key Observations**:
- No axis labels, legends, or numerical data are present.
- Colors are not systematically repeated or grouped, suggesting a non-cyclic or non-hierarchical sequence.
---
### Panel (b): Spatial
- **Structure**:
- A **5x6 grid** (30 squares total) arranged in a matrix format.
- Each square contains a **small colored square** with a distinct hue.
- Colors include: Blue, Red, Green, Yellow, Magenta, Cyan, Black, Brown, and variations thereof.
- **Interpretation**:
- The grid likely represents a **spatial distribution** of entities, with colors indicating categories, statuses, or attributes.
- The uniform grid size suggests equal weighting or equivalence between positions.
- **Key Observations**:
- No axis labels, legends, or numerical data are present.
- Colors are distributed irregularly, with no apparent pattern or clustering.
---
### Comparative Analysis
- **Sequential vs. Spatial**:
- Panel (a) emphasizes **linear progression** (top-to-bottom), while Panel (b) emphasizes **two-dimensional arrangement**.
- Both use color as a categorical variable but lack legends to define color semantics.
- **Limitations**:
- Absence of legends or axis labels prevents interpretation of color meanings or positional significance.
- No numerical data or trends to analyze (e.g., heatmaps, time-series).
---
### Conclusion
The image provides **visual schematics** for sequential and spatial layouts but lacks contextual metadata (e.g., legends, axis titles) to derive quantitative insights. Further clarification is required to interpret the purpose of color coding or positional relationships.