# Technical Document Extraction: LLM Explanation Framework
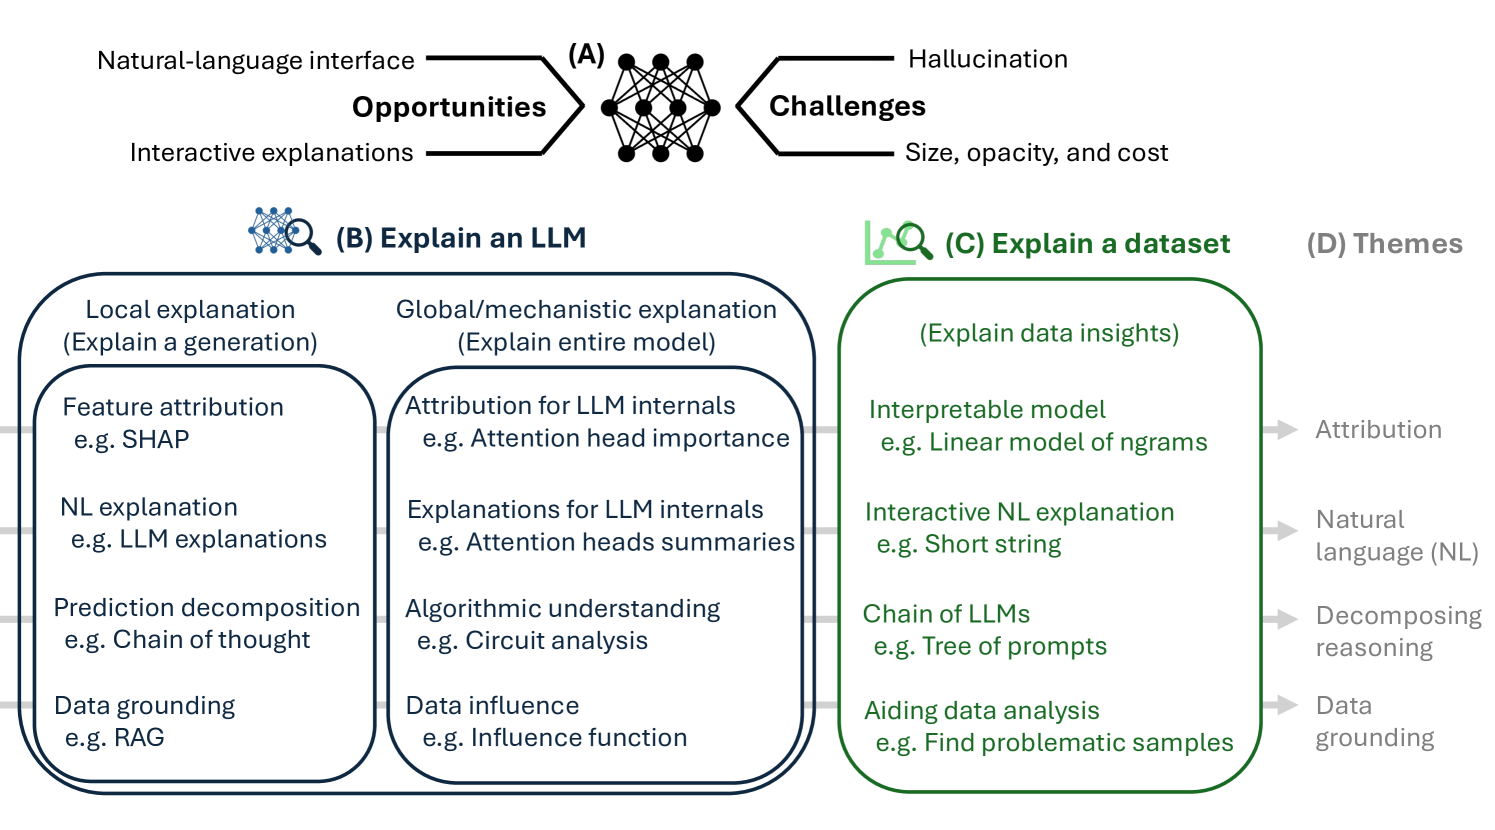
## Section A: Natural-Language Interface for LLMs
**Opportunities**
- Interactive explanations
**Challenges**
- Hallucination
- Size
- Opacity
- Cost
## Section B: Explain an LLM
### Local Explanation (Explain a generation)
- **Feature attribution**
e.g. SHAP
- **NL explanation**
e.g. LLM explanations
- **Prediction decomposition**
e.g. Chain of thought
- **Data grounding**
e.g. RAG
### Global/Mechanistic Explanation (Explain entire model)
- **Attribution for LLM internals**
e.g. Attention head importance
- **Explanations for LLM internals**
e.g. Attention heads summaries
- **Algorithmic understanding**
e.g. Circuit analysis
- **Data influence**
e.g. Influence function
## Section C: Explain a dataset
- **Interpretable model**
e.g. Linear model of ngrams
- **Interactive NL explanation**
e.g. Short string
- **Chain of LLMs**
e.g. Tree of prompts
- **Aiding data analysis**
e.g. Find problematic samples
## Section D: Themes
1. **Attribution**
- Connects to:
- Feature attribution (B)
- Interpretable model (C)
2. **Natural language (NL)**
- Connects to:
- NL explanation (B)
- Interactive NL explanation (C)
3. **Decomposing reasoning**
- Connects to:
- Prediction decomposition (B)
- Chain of LLMs (C)
4. **Data grounding**
- Connects to:
- Data grounding (B)
- Aiding data analysis (C)
## Diagram Flow
1. **Input**: Natural-language interface → (A) → LLMs
2. **Output**:
- Local explanations (B)
- Global explanations (B)
- Dataset explanations (C)
3. **Themes** (D) act as cross-cutting concerns connecting components
## Spatial Grounding
- **Legend**: Not explicitly shown in diagram
- **Color coding**:
- Blue: Section B (Explain an LLM)
- Green: Section C (Explain a dataset)
- Black: Section A (Challenges/Opportunities)
- Gray: Section D (Themes)
## Component Isolation
### Header
- Title: "Natural-language interface"
- Subtitle: "Opportunities | Challenges"
### Main Chart
- **Left (B)**: LLM explanation methods
- **Right (C)**: Dataset explanation methods
- **Connectors**: Arrows between B→C and B→D
### Footer
- Themes (D) listed vertically with cross-references
## Trend Verification
- No numerical data present; diagram focuses on categorical relationships
## Data Table Reconstruction
| Section | Component | Example |
|---------|--------------------------|-----------------------------|
| A | Opportunities | Interactive explanations |
| A | Challenges | Hallucination, Size, etc. |
| B | Local Explanation | Feature attribution (SHAP) |
| B | Global Explanation | Circuit analysis |
| C | Dataset Explanation | Linear model of ngrams |
| D | Themes | Attribution, NL, etc. |
## Language Declaration
- Primary language: English
- No secondary languages detected