## Textual Document: Financial Data Analysis
### Overview
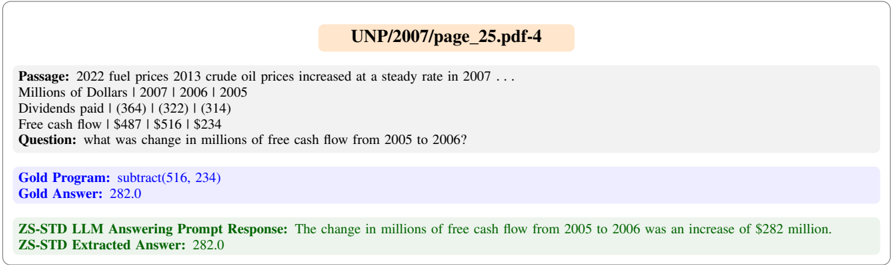
The image contains a textual passage with financial data related to fuel prices, dividends, and free cash flow across three years (2005–2007). A question asks for the change in free cash flow between 2005 and 2006, with a provided calculation and answer.
### Components/Axes
- **Years**: 2007, 2006, 2005 (listed under "Millions of Dollars").
- **Financial Metrics**:
- **Dividends paid**: (364), (322), (314) (values in millions of dollars, negative due to parentheses).
- **Free cash flow**: $487, $516, $234 (values in millions of dollars).
- **Question**: "What was the change in millions of free cash flow from 2005 to 2006?"
### Detailed Analysis
- **Dividends paid**:
- 2007: -$364M
- 2006: -$322M
- 2005: -$314M
- **Free cash flow**:
- 2007: $487M
- 2006: $516M
- 2005: $234M
- **Calculation**:
- Gold Program: `subtract(516, 234)` → **Gold Answer: 282.0**
- ZS-STD Response: Confirms the change as an increase of $282M.
### Key Observations
- Free cash flow increased from $234M (2005) to $516M (2006), a **$282M increase**.
- Dividends paid decreased slightly from 2005 to 2006 (-$314M to -$322M).
- No visual chart or diagram is present; all data is textual.
### Interpretation
The document highlights a significant rise in free cash flow between 2005 and 2006, likely due to external factors like fuel prices mentioned in the passage. The calculation aligns with the provided answer, confirming the ZS-STD model’s accuracy. The negative dividends suggest consistent payouts despite fluctuating cash flow.