## Diagram: Paper Roadmap
### Overview
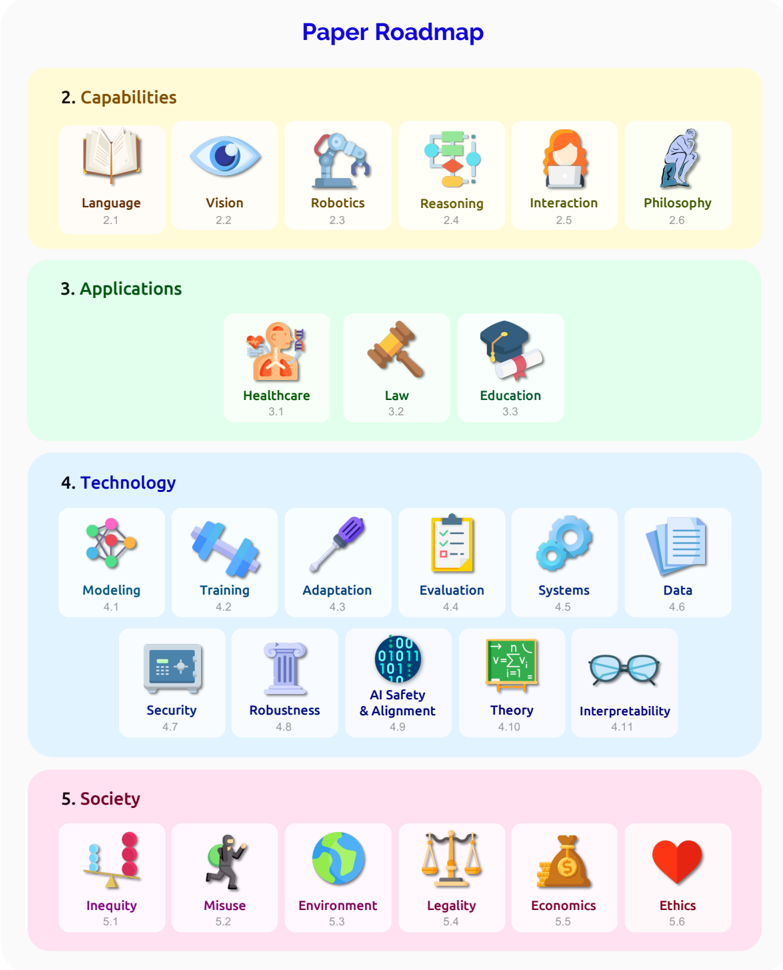
The image presents a "Paper Roadmap" diagram, outlining key areas of focus across capabilities, applications, technology, and society. It's structured as a hierarchical list with icons representing each category.
### Components/Axes
* **Title:** Paper Roadmap
* **Sections:** The diagram is divided into five sections, each with a title and a list of sub-categories.
* **2. Capabilities:** (Yellow background)
* Language (2.1)
* Vision (2.2)
* Robotics (2.3)
* Reasoning (2.4)
* Interaction (2.5)
* Philosophy (2.6)
* **3. Applications:** (Light Green background)
* Healthcare (3.1)
* Law (3.2)
* Education (3.3)
* **4. Technology:** (Light Blue background)
* Modeling (4.1)
* Training (4.2)
* Adaptation (4.3)
* Evaluation (4.4)
* Systems (4.5)
* Data (4.6)
* Security (4.7)
* Robustness (4.8)
* AI Safety & Alignment (4.9)
* Theory (4.10)
* Interpretability (4.11)
* **5. Society:** (Pink background)
* Inequity (5.1)
* Misuse (5.2)
* Environment (5.3)
* Legality (5.4)
* Economics (5.5)
* Ethics (5.6)
### Detailed Analysis or ### Content Details
* **Capabilities:**
* **Language (2.1):** Icon of an open book.
* **Vision (2.2):** Icon of an eye.
* **Robotics (2.3):** Icon of a robotic arm.
* **Reasoning (2.4):** Icon of a flowchart.
* **Interaction (2.5):** Icon of a person with a tablet.
* **Philosophy (2.6):** Icon of a person sitting and thinking.
* **Applications:**
* **Healthcare (3.1):** Icon of a person with a heart and medical symbols.
* **Law (3.2):** Icon of a gavel.
* **Education (3.3):** Icon of a graduation cap and diploma.
* **Technology:**
* **Modeling (4.1):** Icon of a molecular model.
* **Training (4.2):** Icon of dumbbells.
* **Adaptation (4.3):** Icon of a screwdriver.
* **Evaluation (4.4):** Icon of a clipboard with checkboxes.
* **Systems (4.5):** Icon of gears.
* **Data (4.6):** Icon of stacked papers.
* **Security (4.7):** Icon of a safe.
* **Robustness (4.8):** Icon of pillars.
* **AI Safety & Alignment (4.9):** Icon of binary code.
* **Theory (4.10):** Icon of a mathematical formula on a chalkboard.
* **Interpretability (4.11):** Icon of eyeglasses and papers.
* **Society:**
* **Inequity (5.1):** Icon of unbalanced scales.
* **Misuse (5.2):** Icon of a person in a hazmat suit.
* **Environment (5.3):** Icon of the Earth.
* **Legality (5.4):** Icon of balanced scales.
* **Economics (5.5):** Icon of a money bag.
* **Ethics (5.6):** Icon of a heart.
### Key Observations
* The diagram presents a structured overview of different areas related to a central topic, possibly AI or a similar field.
* Each category is represented by a distinct icon, aiding in visual understanding.
* The numbering system (e.g., 2.1, 3.2) suggests a hierarchical organization or a roadmap structure.
### Interpretation
The "Paper Roadmap" diagram likely serves as a high-level guide or framework for research, development, or discussion within a specific domain. The categories (Capabilities, Applications, Technology, Society) represent different facets of the subject matter, and the sub-categories provide more granular areas of focus. The diagram's structure suggests a systematic approach to addressing the topic, considering both technical and societal implications. The icons enhance comprehension and memorability.