\n
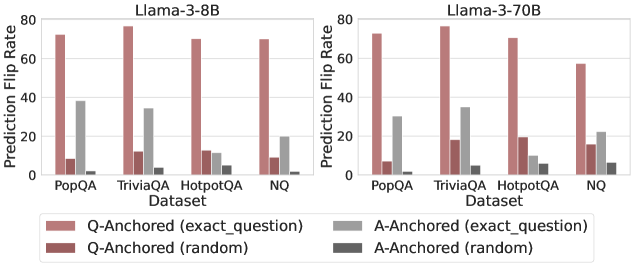
## Bar Chart: Prediction Flip Rate for Llama-3 Models
### Overview
This image presents a comparative bar chart illustrating the Prediction Flip Rate for two Llama-3 models (8B and 70B) across four different datasets: PopQA, TriviaQA, HotpotQA, and NQ. The flip rate is measured for both Question-Anchored (Q-Anchored) and Answer-Anchored (A-Anchored) scenarios, with variations based on whether the anchoring is done using the exact question or a random question.
### Components/Axes
* **X-axis:** Dataset (PopQA, TriviaQA, HotpotQA, NQ)
* **Y-axis:** Prediction Flip Rate (ranging from 0 to 80)
* **Models:** Two separate charts, one for Llama-3-8B (left) and one for Llama-3-70B (right).
* **Legend:** Located at the bottom-center of the image.
* Q-Anchored (exact\_question) - Red
* Q-Anchored (random) - Dark Red
* A-Anchored (exact\_question) - Light Gray
* A-Anchored (random) - Dark Gray
### Detailed Analysis
**Llama-3-8B (Left Chart)**
* **PopQA:**
* Q-Anchored (exact\_question): Approximately 72.
* Q-Anchored (random): Approximately 10.
* A-Anchored (exact\_question): Approximately 32.
* A-Anchored (random): Approximately 12.
* **TriviaQA:**
* Q-Anchored (exact\_question): Approximately 76.
* Q-Anchored (random): Approximately 12.
* A-Anchored (exact\_question): Approximately 24.
* A-Anchored (random): Approximately 10.
* **HotpotQA:**
* Q-Anchored (exact\_question): Approximately 72.
* Q-Anchored (random): Approximately 16.
* A-Anchored (exact\_question): Approximately 16.
* A-Anchored (random): Approximately 8.
* **NQ:**
* Q-Anchored (exact\_question): Approximately 72.
* Q-Anchored (random): Approximately 16.
* A-Anchored (exact\_question): Approximately 16.
* A-Anchored (random): Approximately 8.
**Llama-3-70B (Right Chart)**
* **PopQA:**
* Q-Anchored (exact\_question): Approximately 72.
* Q-Anchored (random): Approximately 24.
* A-Anchored (exact\_question): Approximately 36.
* A-Anchored (random): Approximately 16.
* **TriviaQA:**
* Q-Anchored (exact\_question): Approximately 76.
* Q-Anchored (random): Approximately 20.
* A-Anchored (exact\_question): Approximately 28.
* A-Anchored (random): Approximately 12.
* **HotpotQA:**
* Q-Anchored (exact\_question): Approximately 72.
* Q-Anchored (random): Approximately 20.
* A-Anchored (exact\_question): Approximately 16.
* A-Anchored (random): Approximately 8.
* **NQ:**
* Q-Anchored (exact\_question): Approximately 72.
* Q-Anchored (random): Approximately 20.
* A-Anchored (exact\_question): Approximately 16.
* A-Anchored (random): Approximately 8.
**Trends:**
* In both models, Q-Anchored (exact\_question) consistently exhibits the highest prediction flip rate across all datasets.
* Q-Anchored (random) consistently shows the lowest prediction flip rate.
* A-Anchored (exact\_question) generally has a higher flip rate than A-Anchored (random).
* The 70B model generally shows higher flip rates for A-Anchored scenarios compared to the 8B model.
### Key Observations
* The difference between Q-Anchored (exact\_question) and Q-Anchored (random) is substantial, indicating that using the exact question for anchoring significantly impacts prediction flip rate.
* The 70B model demonstrates a more pronounced difference between A-Anchored (exact\_question) and A-Anchored (random) than the 8B model.
* The prediction flip rate is relatively consistent across the datasets for Q-Anchored (exact\_question).
### Interpretation
The data suggests that anchoring predictions to the exact question (Q-Anchored (exact\_question)) is a highly effective method for inducing prediction flips, resulting in the highest flip rates across all datasets and models. This indicates that the models are sensitive to the specific wording of the question. The lower flip rates observed with random question anchoring suggest that the models are less susceptible to irrelevant or unrelated information.
The larger difference in A-Anchored flip rates for the 70B model suggests that the larger model is more capable of leveraging answer-related information to influence predictions. The consistency of the Q-Anchored (exact\_question) flip rate across datasets implies that this anchoring strategy is robust and generalizable.
The concept of "prediction flip rate" likely refers to the frequency with which the model changes its predicted answer when presented with different anchoring information. This metric is valuable for understanding the model's sensitivity to context and its ability to revise its predictions based on new evidence. The results highlight the importance of carefully considering the anchoring strategy when evaluating and deploying these models.