## Bar Chart: Prediction Flip Rate Comparison for Llama-3-8B and Llama-3-70B Models
### Overview
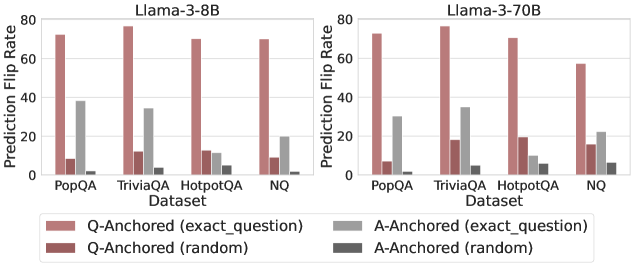
The image compares prediction flip rates across four question-answering datasets (PopQA, TriviaQA, HotpotQA, NQ) for two Llama-3 models (8B and 70B parameters). Four anchoring strategies are visualized: Q-Anchored (exact_question), A-Anchored (exact_question), Q-Anchored (random), and A-Anchored (random). The y-axis represents prediction flip rate (0-80%), while the x-axis categorizes datasets.
### Components/Axes
- **X-Axis (Datasets)**: PopQA, TriviaQA, HotpotQA, NQ (left to right)
- **Y-Axis (Prediction Flip Rate)**: 0-80% in 20% increments
- **Legend (Bottom Center)**:
- Red: Q-Anchored (exact_question)
- Gray: A-Anchored (exact_question)
- Dark Red: Q-Anchored (random)
- Dark Gray: A-Anchored (random)
### Detailed Analysis
#### Llama-3-8B (Left Chart)
- **PopQA**:
- Q-Anchored (exact): ~75%
- A-Anchored (exact): ~38%
- Q-Anchored (random): ~8%
- A-Anchored (random): ~2%
- **TriviaQA**:
- Q-Anchored (exact): ~78%
- A-Anchored (exact): ~35%
- Q-Anchored (random): ~10%
- A-Anchored (random): ~3%
- **HotpotQA**:
- Q-Anchored (exact): ~70%
- A-Anchored (exact): ~12%
- Q-Anchored (random): ~9%
- A-Anchored (random): ~4%
- **NQ**:
- Q-Anchored (exact): ~72%
- A-Anchored (exact): ~20%
- Q-Anchored (random): ~5%
- A-Anchored (random): ~1%
#### Llama-3-70B (Right Chart)
- **PopQA**:
- Q-Anchored (exact): ~75%
- A-Anchored (exact): ~30%
- Q-Anchored (random): ~6%
- A-Anchored (random): ~1%
- **TriviaQA**:
- Q-Anchored (exact): ~78%
- A-Anchored (exact): ~35%
- Q-Anchored (random): ~18%
- A-Anchored (random): ~4%
- **HotpotQA**:
- Q-Anchored (exact): ~72%
- A-Anchored (exact): ~10%
- Q-Anchored (random): ~19%
- A-Anchored (random): ~5%
- **NQ**:
- Q-Anchored (exact): ~58% (↓ 14% vs 8B)
- A-Anchored (exact): ~22%
- Q-Anchored (random): ~15%
- A-Anchored (random): ~6%
### Key Observations
1. **Q-Anchored (exact_question)** consistently shows the highest flip rates across all datasets and models, suggesting superior performance.
2. **Model Size Impact**: Llama-3-70B generally matches or slightly underperforms Llama-3-8B in Q-Anchored (exact) methods, except for NQ where 70B drops 14%.
3. **Random Anchoring**: Both Q and A random anchoring methods show significantly lower flip rates (<20%), indicating poor effectiveness.
4. **A-Anchored (exact_question)** performs better than random methods but lags behind Q-Anchored (exact) by 20-40%.
5. **NQ Dataset Anomaly**: Llama-3-70B shows a notable 14% drop in Q-Anchored (exact) performance compared to 8B, contrary to expectations for larger models.
### Interpretation
The data demonstrates that:
- **Anchoring Strategy Matters More Than Model Size**: Q-Anchored (exact_question) outperforms all other methods regardless of model size, suggesting it captures critical contextual relationships.
- **Diminishing Returns for Larger Models**: The 70B model's performance plateau or decline in some cases (e.g., NQ) implies potential overfitting or architectural limitations in handling specific datasets.
- **Random Anchoring Ineffectiveness**: Both Q and A random methods show minimal utility, highlighting the importance of structured anchoring for prediction reliability.
- **Dataset-Specific Behavior**: NQ's anomalous drop in 70B suggests dataset-model compatibility issues, warranting further investigation into dataset characteristics and model training dynamics.
This analysis underscores the critical role of precise anchoring strategies in question-answering systems, with implications for optimizing model architecture and training protocols.