## Line Chart: Top-rule accuracy vs. Layer for different emotions
### Overview
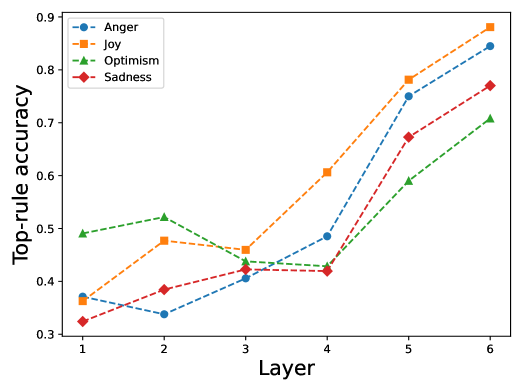
The image is a line chart comparing the "Top-rule accuracy" across different "Layers" (1 to 6) for four emotions: Anger, Joy, Optimism, and Sadness. The chart shows how the accuracy of predicting these emotions changes as the layer increases.
### Components/Axes
* **X-axis (Horizontal):** "Layer", with integer values from 1 to 6.
* **Y-axis (Vertical):** "Top-rule accuracy", ranging from 0.3 to 0.9.
* **Legend (Top-Left):**
* Blue line with circle markers: "Anger"
* Orange line with square markers: "Joy"
* Green line with triangle markers: "Optimism"
* Red line with diamond markers: "Sadness"
### Detailed Analysis
* **Anger (Blue):**
* Trend: Generally increasing with layer.
* Data Points:
* Layer 1: ~0.37
* Layer 2: ~0.34
* Layer 3: ~0.42
* Layer 4: ~0.49
* Layer 5: ~0.73
* Layer 6: ~0.86
* **Joy (Orange):**
* Trend: Increasing with layer.
* Data Points:
* Layer 1: ~0.37
* Layer 2: ~0.48
* Layer 3: ~0.46
* Layer 4: ~0.61
* Layer 5: ~0.78
* Layer 6: ~0.85
* **Optimism (Green):**
* Trend: Initial increase, then decrease, then increase.
* Data Points:
* Layer 1: ~0.49
* Layer 2: ~0.52
* Layer 3: ~0.45
* Layer 4: ~0.43
* Layer 5: ~0.59
* Layer 6: ~0.71
* **Sadness (Red):**
* Trend: Generally increasing with layer.
* Data Points:
* Layer 1: ~0.32
* Layer 2: ~0.39
* Layer 3: ~0.41
* Layer 4: ~0.42
* Layer 5: ~0.67
* Layer 6: ~0.77
### Key Observations
* Joy consistently has the highest accuracy across all layers.
* Anger and Sadness have similar accuracy trends.
* Optimism shows a different trend, with an initial increase followed by a decrease before increasing again.
* All emotions show a significant increase in accuracy from Layer 4 to Layer 6.
### Interpretation
The chart suggests that the model's ability to predict emotions improves as the layer increases, particularly after Layer 4. Joy is the easiest emotion for the model to predict, while Optimism presents more complexity. The performance differences between emotions may be due to the nature of the emotions themselves or the way they are represented in the data. The significant jump in accuracy after Layer 4 could indicate a critical point in the model's architecture or training process where it begins to learn more effectively.