\n
## Line Chart: Top-Rule Accuracy vs. Layer
### Overview
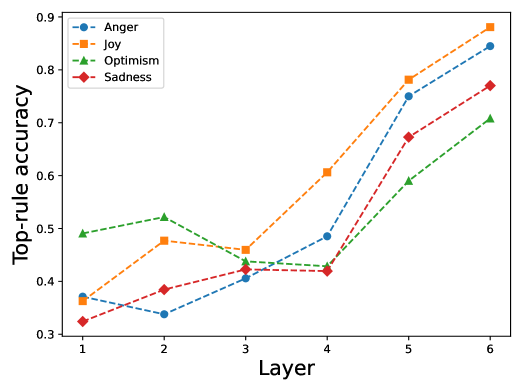
This line chart depicts the relationship between "Layer" (on the x-axis) and "Top-rule accuracy" (on the y-axis) for four different emotions: Anger, Joy, Optimism, and Sadness. The chart shows how the accuracy of a top-rule changes as the layer increases.
### Components/Axes
* **X-axis:** "Layer" - Scale ranges from 1 to 6, with integer markers.
* **Y-axis:** "Top-rule accuracy" - Scale ranges from 0.3 to 0.9, with increments of 0.1.
* **Legend:** Located in the top-left corner, identifying four data series:
* Anger (Blue, dashed line)
* Joy (Orange, dashed line)
* Optimism (Green, triangle markers)
* Sadness (Red, diamond markers)
### Detailed Analysis
Let's analyze each data series individually:
* **Anger (Blue, dashed line):** The line slopes upward overall.
* Layer 1: Approximately 0.38
* Layer 2: Approximately 0.40
* Layer 3: Approximately 0.43
* Layer 4: Approximately 0.45
* Layer 5: Approximately 0.75
* Layer 6: Approximately 0.85
* **Joy (Orange, dashed line):** The line slopes upward consistently.
* Layer 1: Approximately 0.35
* Layer 2: Approximately 0.45
* Layer 3: Approximately 0.48
* Layer 4: Approximately 0.55
* Layer 5: Approximately 0.80
* Layer 6: Approximately 0.88
* **Optimism (Green, triangle markers):** The line initially increases, then decreases, and then increases again.
* Layer 1: Approximately 0.51
* Layer 2: Approximately 0.53
* Layer 3: Approximately 0.47
* Layer 4: Approximately 0.44
* Layer 5: Approximately 0.65
* Layer 6: Approximately 0.74
* **Sadness (Red, diamond markers):** The line slopes upward overall.
* Layer 1: Approximately 0.33
* Layer 2: Approximately 0.38
* Layer 3: Approximately 0.41
* Layer 4: Approximately 0.42
* Layer 5: Approximately 0.70
* Layer 6: Approximately 0.78
### Key Observations
* All four emotions show an increasing trend in top-rule accuracy as the layer increases.
* Joy consistently exhibits the highest accuracy values across all layers.
* Sadness consistently exhibits the lowest accuracy values across all layers.
* Optimism shows a more complex pattern, with a dip in accuracy at Layer 4 before increasing again.
* The most significant accuracy gains for all emotions occur between Layers 4 and 5.
### Interpretation
The data suggests that increasing the layer in the model improves the accuracy of the top-rule for identifying all four emotions (Anger, Joy, Optimism, and Sadness). The consistent upward trend indicates that the model learns more effectively with deeper layers. The higher accuracy of Joy compared to Sadness might indicate that Joy is easier to detect or that the model is better trained on Joyful expressions. The dip in Optimism at Layer 4 could be due to overfitting or a temporary instability in the learning process. The substantial increase in accuracy between Layers 4 and 5 suggests a critical point in the model's learning curve, where it begins to effectively capture more complex features related to emotional recognition. This chart provides valuable insights into the model's performance and suggests that further increasing the layer depth could potentially lead to even higher accuracy, although diminishing returns may eventually be reached.