## Heatmap: Accuracy
### Overview
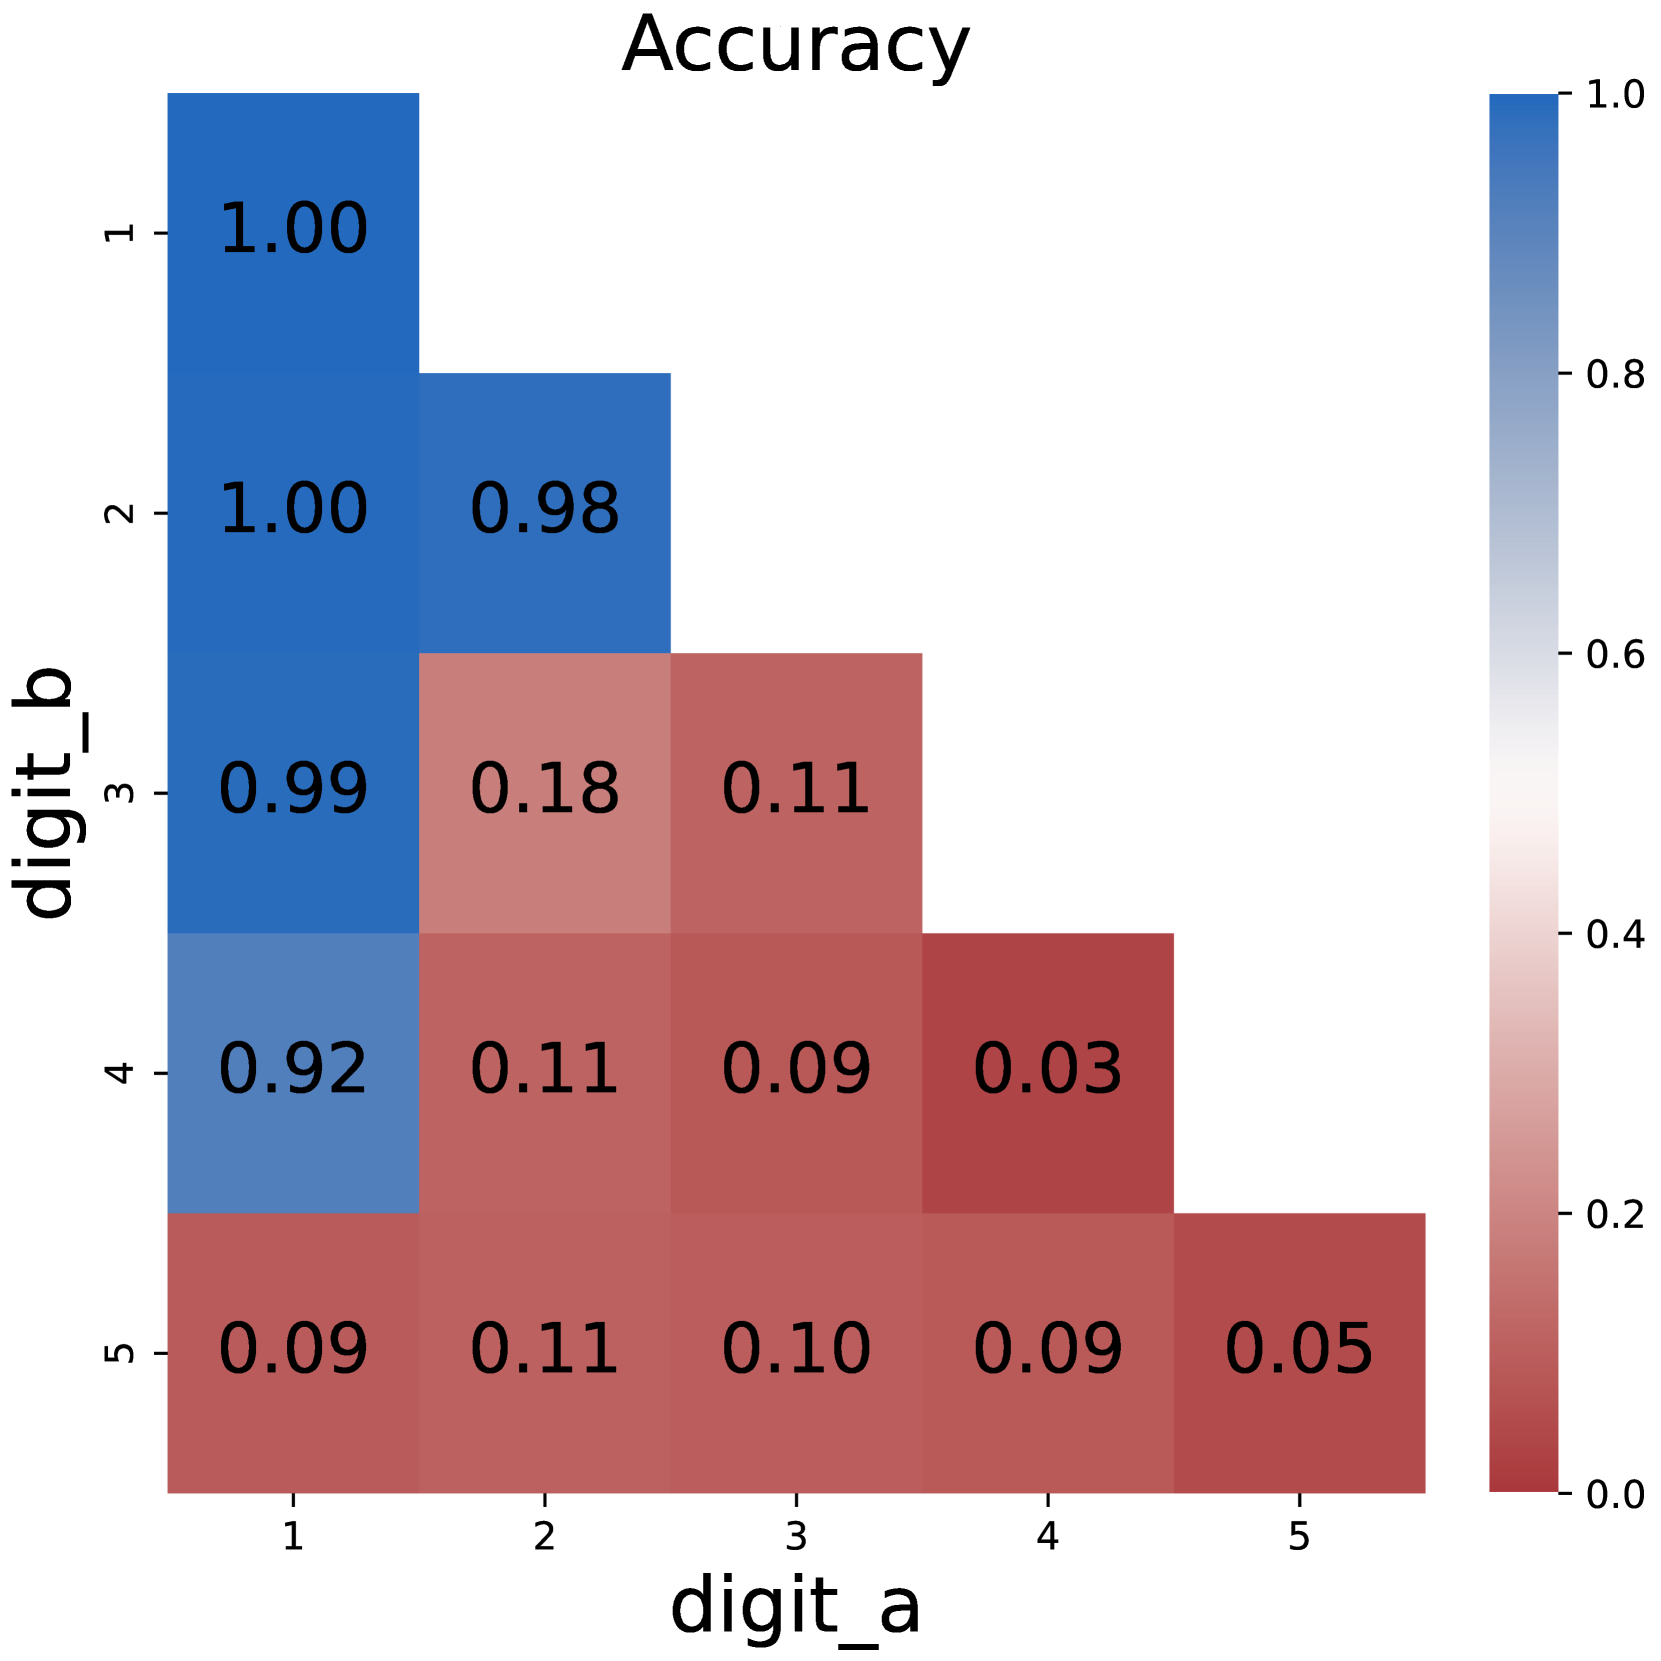
The image is a heatmap visualizing the accuracy of digit comparisons between two variables, `digit_a` (x-axis) and `digit_b` (y-axis). Accuracy values range from 0.0 to 1.0, with blue representing higher accuracy and red representing lower accuracy. The diagonal (where `digit_a` = `digit_b`) shows the highest accuracies, while off-diagonal values decrease as digits diverge.
### Components/Axes
- **Title**: "Accuracy"
- **X-axis**: Labeled "digit_a" with categories 1–5.
- **Y-axis**: Labeled "digit_b" with categories 1–5.
- **Legend**: Positioned on the right, showing a gradient from dark blue (1.0) to red (0.0).
### Detailed Analysis
| digit_b \ digit_a | 1 | 2 | 3 | 4 | 5 |
|-------------------|-------|-------|-------|-------|-------|
| **1** | 1.00 | 1.00 | 0.99 | 0.92 | 0.09 |
| **2** | 1.00 | 0.98 | 0.18 | 0.11 | 0.03 |
| **3** | 0.99 | 0.18 | 0.11 | 0.09 | 0.05 |
| **4** | 0.92 | 0.11 | 0.09 | 0.03 | 0.05 |
| **5** | 0.09 | 0.11 | 0.10 | 0.09 | 0.05 |
- **Diagonal Values**:
- `digit_a` = `digit_b` = 1: 1.00 (dark blue)
- `digit_a` = `digit_b` = 2: 0.98 (dark blue)
- `digit_a` = `digit_b` = 3: 0.99 (dark blue)
- `digit_a` = `digit_b` = 4: 0.92 (light blue)
- `digit_a` = `digit_b` = 5: 0.05 (dark red) — **anomaly** (extremely low accuracy for matching digits).
- **Off-Diagonal Trends**:
- Accuracy decreases as `digit_a` and `digit_b` differ, especially for non-adjacent digits (e.g., 1 vs 5: 0.09).
- Adjacent digits (e.g., 1 vs 2: 1.00, 2 vs 3: 0.18) show mixed performance, with some high and some low values.
### Key Observations
1. **Diagonal Dominance**: The highest accuracies occur when `digit_a` and `digit_b` are identical, except for `digit_b` = 5, which has a critical outlier (0.05).
2. **Confusion Between Digits**:
- Digits 1 and 2 show near-perfect accuracy when compared to themselves but drop sharply when mismatched (e.g., 1 vs 5: 0.09).
- Digit 5 exhibits poor performance overall, with low accuracy even when compared to itself.
3. **Color Gradient Consistency**: Blue shades align with high values (1.0–0.92), while red shades correspond to low values (0.11–0.05).
### Interpretation
The heatmap suggests a classification model optimized for exact digit matches but struggles with distinguishing dissimilar digits, particularly digit 5. The anomaly for `digit_b` = 5 (0.05 accuracy when matched) indicates a potential flaw in the model’s handling of this digit, possibly due to data imbalance, feature extraction issues, or misclassification during training. The sharp drop in accuracy for non-adjacent digits (e.g., 1 vs 5) highlights challenges in generalizing across visually distinct classes. This pattern is typical in digit recognition tasks, where confusion matrices often reveal class-specific weaknesses.