## Chart: Mutual Information Surprise
### Overview
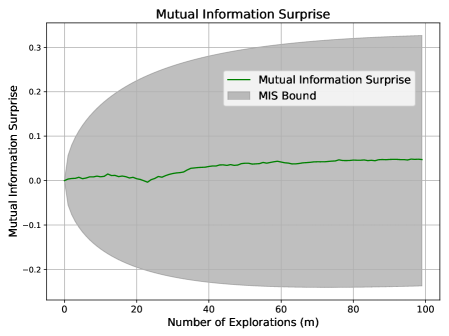
The image is a line chart showing the "Mutual Information Surprise" as a function of the "Number of Explorations (m)". The chart also displays a gray shaded region representing the "MIS Bound". The x-axis represents the number of explorations, ranging from 0 to 100. The y-axis represents the mutual information surprise, ranging from -0.2 to 0.3.
### Components/Axes
* **Title:** Mutual Information Surprise
* **X-axis:**
* Label: Number of Explorations (m)
* Scale: 0 to 100, with tick marks at 0, 20, 40, 60, 80, and 100.
* **Y-axis:**
* Label: Mutual Information Surprise
* Scale: -0.2 to 0.3, with tick marks at -0.2, -0.1, 0.0, 0.1, 0.2, and 0.3.
* **Legend:** Located in the top-right portion of the chart.
* Green Line: Mutual Information Surprise
* Gray Area: MIS Bound
### Detailed Analysis
* **Mutual Information Surprise (Green Line):**
* Trend: Initially fluctuates around 0, dips slightly around x=20, then gradually increases and plateaus around 0.04-0.05 for x > 60.
* Data Points:
* At x=0, y ≈ 0.00
* At x=20, y ≈ -0.01
* At x=40, y ≈ 0.02
* At x=60, y ≈ 0.03
* At x=80, y ≈ 0.04
* At x=100, y ≈ 0.04
* **MIS Bound (Gray Area):**
* The gray area forms a shape that widens from x=0 to approximately x=40, then remains relatively constant. The area is centered around y=0.
* The upper bound of the gray area starts at approximately y=0.0 at x=0 and increases to approximately y=0.28 at x=40, then remains constant.
* The lower bound of the gray area starts at approximately y=0.0 at x=0 and decreases to approximately y=-0.24 at x=40, then remains constant.
### Key Observations
* The Mutual Information Surprise remains within the MIS Bound throughout the entire range of explorations.
* The Mutual Information Surprise initially fluctuates near zero, dips slightly, and then gradually increases before plateauing.
* The MIS Bound widens initially and then stabilizes, indicating a range of possible values for the Mutual Information Surprise.
### Interpretation
The chart illustrates how the Mutual Information Surprise changes as the number of explorations increases. The MIS Bound provides a range within which the Mutual Information Surprise is expected to fall. The fact that the Mutual Information Surprise stays within the MIS Bound suggests that the system is behaving as expected. The initial fluctuations and subsequent plateau in the Mutual Information Surprise may indicate an initial learning phase followed by a stabilization of information gain. The widening of the MIS Bound in the early stages suggests greater uncertainty, which decreases as more explorations are performed.