\n
## Line Chart: Mutual Information Surprise
### Overview
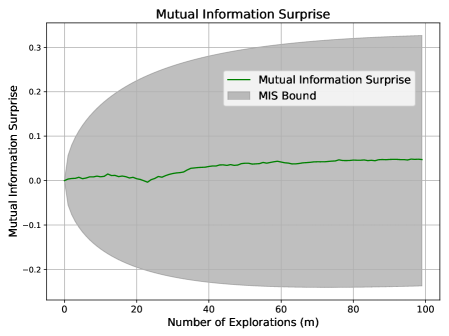
The image presents a line chart illustrating the relationship between the number of explorations (m) and the mutual information surprise. A shaded region represents the MIS (Mutual Information Surprise) bound. The chart aims to visualize how the mutual information surprise changes as the number of explorations increases.
### Components/Axes
* **Title:** "Mutual Information Surprise" (centered at the top)
* **X-axis:** "Number of Explorations (m)" - ranging from 0 to 100, with tick marks at intervals of 10.
* **Y-axis:** "Mutual Information Surprise" - ranging from -0.1 to 0.3, with tick marks at intervals of 0.1.
* **Data Series:**
* "Mutual Information Surprise" - represented by a green line.
* **Legend:** Located in the top-right corner.
* "Mutual Information Surprise" - associated with the green line.
* "MIS Bound" - associated with the gray shaded area.
### Detailed Analysis
The green line representing "Mutual Information Surprise" starts at approximately 0.01 at x=0. It initially decreases slightly to a minimum of approximately -0.02 at x=5. From x=5 to x=60, the line generally increases, reaching a peak of approximately 0.07 at x=60. After x=60, the line fluctuates around 0.06, ending at approximately 0.065 at x=100.
The "MIS Bound" is represented by a gray shaded area. At x=0, the upper bound is approximately 0.3 and the lower bound is approximately -0.1. As the number of explorations increases, the upper bound remains relatively constant at around 0.3, while the lower bound decreases, approaching -0.15 at x=100. The shaded area is widest between x=0 and x=20, indicating a larger uncertainty in the MIS bound during the initial explorations.
### Key Observations
* The Mutual Information Surprise initially decreases with a small number of explorations, then increases and plateaus.
* The MIS Bound widens initially and then narrows as the number of explorations increases.
* The Mutual Information Surprise line remains within the MIS Bound throughout the entire range of explorations.
* The Mutual Information Surprise appears to converge towards a stable value as the number of explorations increases.
### Interpretation
The chart suggests that the mutual information surprise is initially low and somewhat unstable with a small number of explorations. As the number of explorations increases, the mutual information surprise grows, indicating that more information is being gained. However, the rate of information gain diminishes as the number of explorations continues to increase, eventually reaching a plateau. The MIS bound provides a confidence interval for the mutual information surprise, and the narrowing of this bound with increasing explorations suggests that the estimate of the mutual information surprise becomes more precise as more data is collected. The fact that the Mutual Information Surprise line stays within the MIS bound indicates that the observed values are consistent with the expected range of values. This could be indicative of a learning process where initial explorations are noisy, but subsequent explorations yield more reliable and informative results.