## Line Chart with Confidence Interval: Mutual Information Surprise
### Overview
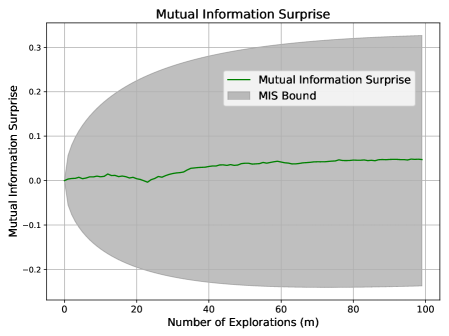
The image displays a line chart titled "Mutual Information Surprise," plotting a metric against the number of explorations. The chart includes a central trend line and a shaded region representing a bound or confidence interval.
### Components/Axes
* **Chart Title:** "Mutual Information Surprise" (centered at the top).
* **X-Axis:**
* **Label:** "Number of Explorations (m)"
* **Scale:** Linear, ranging from 0 to 100.
* **Major Tick Marks:** 0, 20, 40, 60, 80, 100.
* **Y-Axis:**
* **Label:** "Mutual Information Surprise"
* **Scale:** Linear, ranging from approximately -0.25 to 0.35.
* **Major Tick Marks:** -0.2, -0.1, 0.0, 0.1, 0.2, 0.3.
* **Legend:** Located in the top-right quadrant of the chart area.
* **Green Line:** Labeled "Mutual Information Surprise".
* **Gray Shaded Area:** Labeled "MIS Bound".
### Detailed Analysis
* **Data Series - "Mutual Information Surprise" (Green Line):**
* **Trend:** The line shows a generally stable, slightly increasing trend with minor fluctuations.
* **Key Points (Approximate):**
* At m=0, the value is ~0.0.
* The line remains close to 0.0 until approximately m=20.
* There is a slight dip to a local minimum of ~ -0.01 around m=25.
* From m=30 onward, the line exhibits a very gradual upward slope.
* At m=50, the value is ~0.03.
* At m=75, the value is ~0.04.
* At m=100, the value is ~0.05.
* **Data Series - "MIS Bound" (Gray Shaded Area):**
* **Trend:** The bound starts very narrow and expands symmetrically (or nearly symmetrically) around the green line as the number of explorations (m) increases.
* **Key Points (Approximate):**
* At m=0, the bound is negligible, spanning roughly -0.01 to 0.01.
* At m=25, the bound spans approximately -0.15 to 0.15.
* At m=50, the bound spans approximately -0.22 to 0.28.
* At m=100, the bound is at its widest, spanning approximately -0.25 to 0.33.
### Key Observations
1. **Stability of the Core Metric:** The "Mutual Information Surprise" value itself remains relatively small and stable, staying within the narrow range of -0.01 to 0.05 across all 100 explorations.
2. **Diverging Uncertainty:** The most prominent feature is the "MIS Bound," which grows significantly wider as the number of explorations increases. This indicates that the uncertainty or potential range of the surprise metric expands with more data/explorations.
3. **Minor Anomaly:** A small, localized dip in the green line occurs around m=25, which is the only notable deviation from its otherwise smooth, slightly ascending path.
### Interpretation
This chart likely illustrates a concept from information theory or machine learning, possibly related to active learning or Bayesian optimization. "Mutual Information Surprise" could measure how unexpected new data points are given the current model.
* **What the data suggests:** The core finding is that while the *average* or *expected* surprise (green line) increases only marginally with more explorations, the *potential range* of surprise (gray bound) grows dramatically. This implies that as the system explores more, it encounters a wider spectrum of possible outcomes—some highly surprising (positive values) and some highly predictable (negative values)—even if the central tendency changes little.
* **Relationship between elements:** The green line represents the central estimate or mean of the surprise. The gray "MIS Bound" likely represents a confidence interval, standard deviation, or theoretical bound (e.g., based on the Cramér-Rao bound or similar). The widening bound suggests that the estimator's variance increases with `m`, or that the theoretical limits of predictability become more extreme.
* **Notable implication:** The chart demonstrates a key trade-off: more exploration leads to a better understanding of the *possible* range of outcomes (wider bound), but does not necessarily lead to a dramatic shift in the *average* outcome (stable green line). The dip at m=25 could indicate a specific point where the model encountered a cluster of highly predictable data before resuming a trend of slightly increasing average surprise.