## Line Graph: Mutual Information Surprise
### Overview
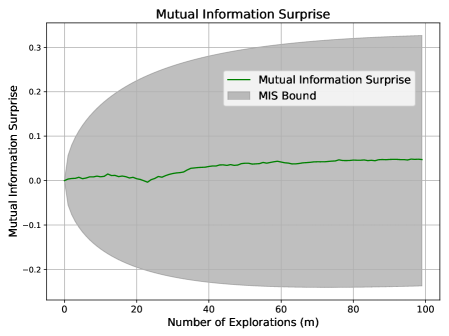
The image depicts a line graph titled "Mutual Information Surprise," illustrating the relationship between the number of explorations (x-axis) and mutual information surprise (y-axis). A green line represents the "Mutual Information Surprise" metric, while a gray shaded region labeled "MIS Bound" defines a theoretical boundary. The graph spans 100 explorations on the x-axis and ranges from -0.2 to 0.3 on the y-axis.
### Components/Axes
- **X-axis**: "Number of Explorations (m)" with increments of 20 (0, 20, 40, 60, 80, 100).
- **Y-axis**: "Mutual Information Surprise" with increments of 0.1 (-0.2, -0.1, 0.0, 0.1, 0.2, 0.3).
- **Legend**: Located in the top-right corner, with:
- **Green line**: "Mutual Information Surprise"
- **Gray shaded area**: "MIS Bound"
### Detailed Analysis
1. **Mutual Information Surprise (Green Line)**:
- Starts at approximately **0.0** when x=0.
- Dips slightly below 0.0 (~-0.05) around x=20.
- Rises to **~0.05** at x=40.
- Stabilizes between **0.05–0.07** from x=60 to x=100.
2. **MIS Bound (Gray Shaded Area)**:
- Begins at **y=-0.2** (x=0) and curves upward.
- Intersects the green line at x=20 (y~-0.05).
- Extends horizontally to the right, covering the area above the green line up to **y=0.3**.
- The upper boundary of the shaded region plateaus at **y=0.3** from x=60 onward.
### Key Observations
- The green line exhibits a **slight dip at x=20** before increasing, suggesting an initial decrease in mutual information surprise followed by stabilization.
- The MIS Bound starts below the x-axis, meets the green line at x=20, and forms a theoretical upper limit for mutual information surprise.
- The shaded region’s upper boundary (y=0.3) remains constant after x=60, indicating a theoretical cap on mutual information surprise.
### Interpretation
- **Trend Analysis**: The green line’s dip at x=20 may reflect an initial phase where exploration reduces mutual information surprise (e.g., due to noise or suboptimal strategies), followed by recovery and stabilization. The plateau at higher x-values suggests diminishing returns in mutual information gain after ~60 explorations.
- **MIS Bound Significance**: The gray shaded area likely represents a confidence interval or theoretical maximum for mutual information surprise. The green line consistently stays within this bound, implying that the observed values are constrained by the system’s inherent uncertainty or design limits.
- **Practical Implications**: The stabilization of mutual information surprise after ~60 explorations highlights a potential threshold for optimal exploration efficiency. The MIS Bound provides a benchmark for evaluating system performance or theoretical limits in information-theoretic models.