## Line Graph: Update Steps vs ID Hops Generalized (k)
### Overview
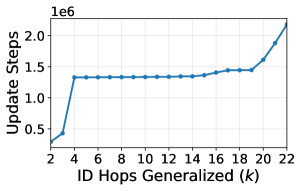
The graph illustrates the relationship between "Update Steps" (y-axis) and "ID Hops Generalized (k)" (x-axis). The y-axis uses a logarithmic scale (1e6), and the x-axis ranges from 2 to 22. A single blue line represents the data, with a notable plateau followed by a sharp increase.
### Components/Axes
- **Y-Axis**: Labeled "Update Steps" with a logarithmic scale (1e6). Tick marks at 0.5, 1.0, 1.5, and 2.0 (units: 1e6).
- **X-Axis**: Labeled "ID Hops Generalized (k)" with integer markers from 2 to 22.
- **Legend**: Located in the top-right corner, indicating "Update Steps" with a blue line.
- **Line**: Blue, single data series, plotted with markers at each x-axis value.
### Detailed Analysis
- **Initial Rise**: At k=2, the line starts at approximately 0.5e6 update steps. By k=4, it rises sharply to ~1.3e6 and remains flat until k=14.
- **Plateau**: From k=4 to k=14, update steps stabilize at ~1.3e6.
- **Post-Plateau Increase**: After k=14, the line gradually increases to ~1.5e6 by k=18, then accelerates sharply to ~2.0e6 at k=22.
### Key Observations
1. **Stability**: A prolonged plateau (k=4–14) suggests minimal update steps for moderate k values.
2. **Threshold Effect**: A sharp increase begins at k=18, indicating a potential system threshold or inefficiency at higher k values.
3. **Logarithmic Scale Impact**: The y-axis compression makes the final spike (k=18–22) appear steeper than its absolute magnitude (0.5e6 increase).
### Interpretation
The data implies that update steps remain efficient for k ≤ 14 but degrade significantly as k approaches 22. This could reflect a computational bottleneck or algorithmic inefficiency at higher k values. The logarithmic y-axis may exaggerate the perceived severity of the final increase, warranting further investigation into the system's behavior beyond k=14. The plateau suggests an optimized range for k, while the post-plateau trend highlights a critical failure point requiring optimization.