## Line Graph: Update Steps vs. ID Hops Generalized (k)
### Overview
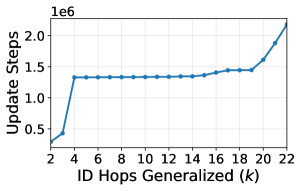
The line graph depicts the relationship between the number of ID hops generalized (k) and the update steps. The x-axis represents the number of ID hops generalized, while the y-axis represents the update steps. The line graph shows a sharp increase in update steps as the number of ID hops generalized increases.
### Components/Axes
- **X-axis**: ID Hops Generalized (k)
- **Y-axis**: Update Steps
- **Legend**: No legend is present in the image.
- **Axis Titles**: X-axis is labeled "ID Hops Generalized (k)" and Y-axis is labeled "Update Steps".
### Content Details
The line graph shows a sharp increase in update steps as the number of ID hops generalized increases. The update steps start at approximately 500,000 when k is 2, and increase to approximately 2,000,000 when k is 20. The update steps then increase rapidly, reaching approximately 2,500,000 when k is 22.
### Interpretation
The data suggests that as the number of ID hops generalized increases, the update steps also increase. This could be due to the fact that more ID hops generalized require more updates to be made. The rapid increase in update steps as the number of ID hops generalized increases could be due to the fact that the system is becoming more complex as the number of ID hops generalized increases. The high level of update steps when k is 22 could be due to the fact that the system is reaching its maximum capacity for handling ID hops generalized. Overall, the data suggests that the system is becoming more complex as the number of ID hops generalized increases, and that the update steps are increasing rapidly as a result.