## Multiple Line Charts: Model Performance on Different Tasks
### Overview
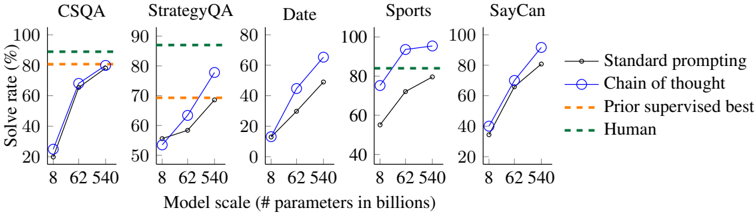
The image presents a series of five line charts, each depicting the performance of different language models on a specific task. The x-axis represents the model scale (number of parameters in billions), and the y-axis represents the solve rate (percentage). The charts compare the performance of "Standard prompting" and "Chain of thought" methods against "Prior supervised best" and "Human" baselines.
### Components/Axes
* **Titles (Top):** CSQA, StrategyQA, Date, Sports, SayCan (each chart corresponds to one of these titles)
* **X-axis:**
* Label: "Model scale (# parameters in billions)"
* Scale: 8, 62, 540
* **Y-axis:**
* Label: "Solve rate (%)"
* Scale: 0 to 100, incrementing by 20
* **Legend (Right):**
* "Standard prompting" - Black line with circle markers
* "Chain of thought" - Blue line with circle markers
* "Prior supervised best" - Orange dashed line
* "Human" - Green dashed line
### Detailed Analysis
**1. CSQA**
* **Standard prompting (Black):** Starts at approximately 25% at 8 billion parameters, rises to approximately 70% at 62 billion parameters, and reaches approximately 80% at 540 billion parameters.
* **Chain of thought (Blue):** Starts at approximately 25% at 8 billion parameters, rises to approximately 68% at 62 billion parameters, and reaches approximately 80% at 540 billion parameters.
* **Prior supervised best (Orange dashed):** Constant at approximately 82%.
* **Human (Green dashed):** Constant at approximately 90%.
**2. StrategyQA**
* **Standard prompting (Black):** Starts at approximately 52% at 8 billion parameters, rises to approximately 60% at 62 billion parameters, and reaches approximately 70% at 540 billion parameters.
* **Chain of thought (Blue):** Starts at approximately 55% at 8 billion parameters, rises to approximately 78% at 62 billion parameters, and reaches approximately 80% at 540 billion parameters.
* **Prior supervised best (Orange dashed):** Constant at approximately 60%.
* **Human (Green dashed):** Constant at approximately 85%.
**3. Date**
* **Standard prompting (Black):** Starts at approximately 12% at 8 billion parameters, rises to approximately 30% at 62 billion parameters, and reaches approximately 50% at 540 billion parameters.
* **Chain of thought (Blue):** Starts at approximately 12% at 8 billion parameters, rises to approximately 50% at 62 billion parameters, and reaches approximately 65% at 540 billion parameters.
* **Prior supervised best (Orange dashed):** Not present in this chart.
* **Human (Green dashed):** Not present in this chart.
**4. Sports**
* **Standard prompting (Black):** Starts at approximately 52% at 8 billion parameters, rises to approximately 72% at 62 billion parameters, and reaches approximately 82% at 540 billion parameters.
* **Chain of thought (Blue):** Starts at approximately 70% at 8 billion parameters, rises to approximately 92% at 62 billion parameters, and reaches approximately 95% at 540 billion parameters.
* **Prior supervised best (Orange dashed):** Not present in this chart.
* **Human (Green dashed):** Constant at approximately 85%.
**5. SayCan**
* **Standard prompting (Black):** Starts at approximately 35% at 8 billion parameters, rises to approximately 70% at 62 billion parameters, and reaches approximately 80% at 540 billion parameters.
* **Chain of thought (Blue):** Starts at approximately 40% at 8 billion parameters, rises to approximately 70% at 62 billion parameters, and reaches approximately 82% at 540 billion parameters.
* **Prior supervised best (Orange dashed):** Not present in this chart.
* **Human (Green dashed):** Not present in this chart.
### Key Observations
* The "Chain of thought" method generally outperforms "Standard prompting," especially at larger model scales.
* The performance gap between "Chain of thought" and "Standard prompting" varies across different tasks.
* The "Prior supervised best" and "Human" baselines provide a benchmark for the models' performance.
* The "Date" task shows the lowest solve rates for both methods, indicating it is the most challenging task.
* The "Sports" task shows the highest solve rates, with "Chain of thought" approaching human-level performance.
### Interpretation
The charts demonstrate the impact of model scale and prompting methods on the performance of language models across various tasks. The "Chain of thought" method appears to be more effective at leveraging larger model scales, leading to improved solve rates. The comparison with "Prior supervised best" and "Human" baselines highlights the progress made by these models and the remaining gap to achieve human-level performance in certain tasks. The variability in performance across different tasks suggests that some tasks are inherently more challenging for language models. The "Date" task, in particular, may require more sophisticated reasoning or knowledge representation capabilities.