## Line Charts: Solve Rate vs. Model Scale for Different Tasks
### Overview
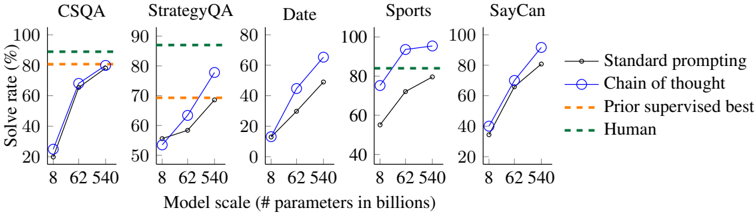
The image presents five separate line charts, each depicting the "Solve Rate" (in percentage) as a function of "Model Scale" (measured in billions of parameters). Each chart corresponds to a different task: CSQA, StrategyQA, Date, Sports, and SayCan. Four different prompting/performance methods are compared: "Standard prompting", "Chain of thought", "Prior supervised best", and "Human" performance.
### Components/Axes
* **X-axis:** "Model scale (# parameters in billions)". Markers are at 8, 62, and 540.
* **Y-axis:** "Solve rate (%)". Scale ranges from 0 to 100.
* **Tasks (Chart Titles):** CSQA, StrategyQA, Date, Sports, SayCan.
* **Legend (Top-Right):**
* Black solid line: "Standard prompting"
* Blue circle-connected line: "Chain of thought"
* Orange dashed line: "Prior supervised best"
* Green dashed line: "Human"
### Detailed Analysis or Content Details
**CSQA:**
* **Standard prompting (Black):** Starts at approximately 20% at 8 billion parameters, rises to around 75% at 62 billion, and reaches approximately 85% at 540 billion. The line slopes upward.
* **Chain of thought (Blue):** Starts at approximately 20% at 8 billion parameters, rises sharply to around 85% at 62 billion, and reaches approximately 90% at 540 billion. The line slopes upward.
* **Prior supervised best (Orange):** Remains relatively constant at approximately 80% across all model scales.
* **Human (Green):** Remains constant at 100% across all model scales.
**StrategyQA:**
* **Standard prompting (Black):** Starts at approximately 50% at 8 billion parameters, rises to around 65% at 62 billion, and reaches approximately 75% at 540 billion. The line slopes upward.
* **Chain of thought (Blue):** Starts at approximately 50% at 8 billion parameters, rises sharply to around 85% at 62 billion, and reaches approximately 90% at 540 billion. The line slopes upward.
* **Prior supervised best (Orange):** Starts at approximately 70% at 8 billion parameters, rises to around 75% at 62 billion, and remains around 75% at 540 billion.
* **Human (Green):** Remains constant at approximately 95% across all model scales.
**Date:**
* **Standard prompting (Black):** Starts at approximately 40% at 8 billion parameters, rises to around 60% at 62 billion, and reaches approximately 70% at 540 billion. The line slopes upward.
* **Chain of thought (Blue):** Starts at approximately 0% at 8 billion parameters, rises sharply to around 75% at 62 billion, and reaches approximately 80% at 540 billion. The line slopes upward.
* **Prior supervised best (Orange):** Remains relatively constant at approximately 65% across all model scales.
* **Human (Green):** Remains constant at approximately 85% across all model scales.
**Sports:**
* **Standard prompting (Black):** Starts at approximately 50% at 8 billion parameters, rises to around 70% at 62 billion, and reaches approximately 80% at 540 billion. The line slopes upward.
* **Chain of thought (Blue):** Starts at approximately 60% at 8 billion parameters, rises sharply to around 95% at 62 billion, and remains around 95% at 540 billion. The line slopes upward.
* **Prior supervised best (Orange):** Remains relatively constant at approximately 80% across all model scales.
* **Human (Green):** Remains constant at approximately 90% across all model scales.
**SayCan:**
* **Standard prompting (Black):** Starts at approximately 20% at 8 billion parameters, rises to around 60% at 62 billion, and reaches approximately 90% at 540 billion. The line slopes upward.
* **Chain of thought (Blue):** Starts at approximately 40% at 8 billion parameters, rises sharply to around 95% at 62 billion, and reaches approximately 100% at 540 billion. The line slopes upward.
* **Prior supervised best (Orange):** Remains relatively constant at approximately 80% across all model scales.
* **Human (Green):** Remains constant at approximately 90% across all model scales.
### Key Observations
* "Chain of thought" consistently outperforms "Standard prompting" across all tasks and model scales.
* "Prior supervised best" performance is relatively stable and generally lower than "Chain of thought" but often comparable to or slightly better than "Standard prompting" at larger model scales.
* "Human" performance sets the upper bound for solve rate, and is consistently higher than all model-based approaches.
* The performance gap between the methods tends to narrow as the model scale increases, particularly for "Standard prompting".
* The largest performance gains from increasing model scale are observed for "Chain of thought".
### Interpretation
The data demonstrates the significant impact of prompting strategies ("Chain of thought" vs. "Standard prompting") on the performance of language models across a variety of tasks. The "Chain of thought" approach enables models to achieve substantially higher solve rates, especially as model scale increases. This suggests that the ability to reason step-by-step, facilitated by "Chain of thought", is crucial for tackling complex tasks. The relatively stable performance of "Prior supervised best" indicates that pre-training on task-specific data provides a baseline level of competence, but it doesn't match the adaptability and scalability of "Chain of thought". The consistent high performance of "Human" serves as a benchmark, highlighting the remaining gap between AI and human intelligence. The narrowing gap between "Standard prompting" and other methods at larger model scales suggests that simply increasing model size can partially compensate for the lack of sophisticated prompting, but it is not as effective as employing a reasoning-based approach like "Chain of thought". The varying performance across tasks suggests that the effectiveness of different prompting strategies may be task-dependent.