## Line Chart: Model Scale vs. Solve Rate Across Datasets
### Overview
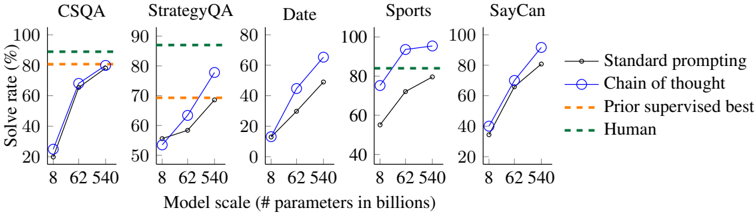
The chart compares the performance of different prompting methods (Standard prompting, Chain of thought, Prior supervised best) and human performance across five datasets (CSQA, StrategyQA, Date, Sports, SayCan) as model scale increases from 8B to 540B parameters. Solve rate is measured in percentage, with human performance represented as a dashed green line.
### Components/Axes
- **X-axis**: Model scale (# parameters in billions) with markers at 8, 62, and 540.
- **Y-axis**: Solve rate (%) ranging from 0 to 100 in 20% increments.
- **Legend**:
- Black line: Standard prompting
- Blue line with circles: Chain of thought
- Orange dashed line: Prior supervised best
- Green dashed line: Human
### Detailed Analysis
#### CSQA
- **Chain of thought (blue)**: Starts at ~20% (8B), rises to ~80% (540B).
- **Standard prompting (black)**: Starts at ~10% (8B), reaches ~60% (540B).
- **Prior supervised best (orange dashed)**: Flat at ~80% across all scales.
- **Human (green dashed)**: Constant at 100%.
#### StrategyQA
- **Chain of thought (blue)**: Starts at ~50% (8B), increases to ~70% (540B).
- **Standard prompting (black)**: Starts at ~30% (8B), reaches ~60% (540B).
- **Prior supervised best (orange dashed)**: Flat at ~60%.
- **Human (green dashed)**: Constant at 90%.
#### Date
- **Chain of thought (blue)**: Starts at ~10% (8B), jumps to ~60% (62B), then ~80% (540B).
- **Standard prompting (black)**: Starts at ~5% (8B), rises to ~70% (540B).
- **Prior supervised best (orange dashed)**: Flat at ~40%.
- **Human (green dashed)**: Constant at 80%.
#### Sports
- **Chain of thought (blue)**: Starts at ~40% (8B), increases to ~80% (62B), then ~90% (540B).
- **Standard prompting (black)**: Starts at ~30% (8B), reaches ~80% (540B).
- **Prior supervised best (orange dashed)**: Flat at ~70%.
- **Human (green dashed)**: Constant at 100%.
#### SayCan
- **Chain of thought (blue)**: Starts at ~30% (8B), rises to ~70% (62B), then ~90% (540B).
- **Standard prompting (black)**: Starts at ~20% (8B), reaches ~80% (540B).
- **Prior supervised best (orange dashed)**: Flat at ~60%.
- **Human (green dashed)**: Constant at 100%.
### Key Observations
1. **Chain of thought (blue)** consistently outperforms Standard prompting (black) across all datasets and scales, with performance gains accelerating as model size increases.
2. **Prior supervised best (orange dashed)** shows no improvement with model scaling, remaining flat across all datasets.
3. **Human performance (green dashed)** is the highest benchmark, often exceeding all methods (e.g., 100% in CSQA, Sports, and SayCan).
4. **Date dataset** shows the most dramatic improvement for Chain of thought, jumping from ~10% (8B) to ~80% (540B).
### Interpretation
- **Model scaling benefits Chain of thought**: The steep upward trends for Chain of thought suggest that larger models better capture complex reasoning patterns, enabling higher solve rates.
- **Prior supervised best stagnation**: The flat orange dashed lines indicate that pre-trained supervised models reach a performance ceiling, unaffected by scale increases.
- **Human as the gold standard**: Human performance (green dashed) remains the highest across all datasets, highlighting the gap between current AI capabilities and human-level reasoning.
- **Dataset-specific trends**: The Date dataset shows the largest performance gap between methods, while Sports and SayCan demonstrate closer alignment between Chain of thought and human performance at larger scales.
This analysis underscores the importance of prompting strategies (e.g., Chain of thought) in leveraging model scale for reasoning tasks, while also revealing limitations in purely supervised approaches.