\n
## Diagram: Cognitive Functions to Computational Model
### Overview
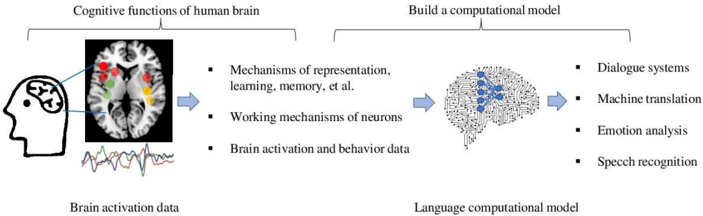
This diagram illustrates a process flow from understanding cognitive functions of the human brain to building a computational model. It depicts three main stages: brain activation data acquisition, analysis of brain mechanisms, and the resulting language computational model. The diagram uses visual representations of a human head, brain scans, and a neural network-like brain model to convey the process.
### Components/Axes
The diagram is structured linearly from left to right, with the following components:
* **Stage 1: Cognitive functions of human brain** - Represented by a sketch of a human head profile.
* **Stage 2: Brain activation data** - Shown as a brain scan (axial view) with highlighted areas and a waveform graph below.
* **Stage 3: Mechanisms of representation, learning, memory, et al.** - A list of bullet points describing the analysis of brain data.
* **Stage 4: Build a computational model** - Represented by a complex network resembling a brain.
* **Stage 5: Language computational model** - A list of bullet points describing applications of the computational model.
There are no explicit axes or scales in this diagram. The flow is indicated by arrows connecting the stages.
### Detailed Analysis or Content Details
The diagram presents a sequential process.
* **Stage 1:** A simplified sketch of a human head in profile.
* **Stage 2:** A brain scan (likely MRI or CT) in axial view. Several areas are highlighted in red. Below the scan is a waveform graph with multiple lines fluctuating over time. The waveform appears to have at least three distinct lines, each with varying amplitude and frequency.
* **Stage 3:** A list of three bullet points:
* "Mechanisms of representation, learning, memory, et al."
* "Working mechanisms of neurons"
* "Brain activation and behavior data"
* **Stage 4:** A complex network of interconnected nodes resembling a brain. The nodes are connected by lines, forming a dense network.
* **Stage 5:** A list of four bullet points:
* "Dialogue systems"
* "Machine translation"
* "Emotion analysis"
* "Speech recognition"
### Key Observations
The diagram highlights the progression from biological brain activity to an abstract computational model. The highlighted areas in the brain scan suggest specific regions of interest for study. The waveform graph likely represents electrophysiological data (e.g., EEG or MEG). The final stage demonstrates the practical applications of the computational model in various language-related tasks.
### Interpretation
The diagram illustrates the core concept of computational neuroscience: using data from the human brain to build artificial intelligence systems. The process begins with observing and recording brain activity (Stage 2), then analyzing the underlying mechanisms (Stage 3), and finally translating these mechanisms into a computational model (Stage 4) that can perform complex tasks like language processing (Stage 5). The diagram suggests a reductionist approach, where complex cognitive functions are broken down into smaller, more manageable components that can be modeled computationally. The "et al." in the first bullet point of Stage 3 indicates that the list is not exhaustive, and many other brain mechanisms are relevant to this process. The diagram doesn't provide quantitative data, but rather a conceptual overview of the workflow. It implies a causal relationship: understanding the brain leads to the creation of intelligent systems.