## Flowchart: Cognitive Functions to Computational Language Models
### Overview
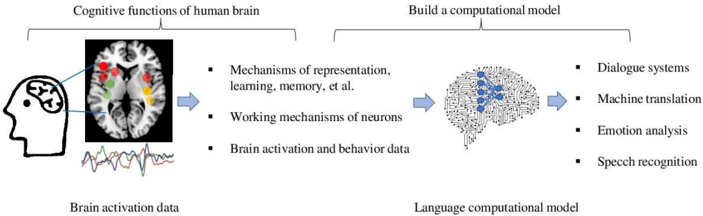
The image is a conceptual flowchart illustrating the relationship between human brain cognitive functions and computational language models. It visually connects brain activation data to a network-based computational model, with applications in language processing.
### Components/Axes
1. **Left Section (Cognitive Functions of Human Brain)**:
- **Brain Image**: Labeled "Cognitive functions of human brain" with colored dots (red, green, yellow) highlighting specific regions.
- **Brain Activation Data Graph**: A waveform labeled "Brain activation and behavior data" with multiple colored lines (red, green, blue, yellow).
- **Key Labels**:
- "Mechanisms of representation, learning, memory, et al."
- "Working mechanisms of neurons"
2. **Right Section (Build a Computational Model)**:
- **Network Diagram**: Labeled "Language computational model" with interconnected blue nodes and edges.
- **Applications**:
- Dialogue systems
- Machine translation
- Emotion analysis
- Speech recognition
3. **Flow Arrows**:
- Blue arrows connect brain activation data to the computational model.
- Arrows link the computational model to its applications.
### Detailed Analysis
- **Brain Activation Data Graph**: No numerical axes or scales are visible. The colored lines likely represent different cognitive processes or brain regions, but no legend clarifies this.
- **Computational Model Network**: Nodes and edges are uniformly blue, with no explicit labels for individual components. The structure suggests a distributed network architecture.
- **Applications List**: Text-based bullet points without hierarchical organization.
### Key Observations
1. **Color Coding**: Red, green, and yellow dots in the brain image may indicate distinct functional regions (e.g., red for language areas, green for memory, yellow for emotion), but this is speculative without a legend.
2. **Flow Direction**: The diagram emphasizes a unidirectional flow from biological brain data to artificial computational models.
3. **Missing Data**: No numerical values, scales, or quantitative metrics are present in the graph or network diagram.
### Interpretation
The flowchart conceptualizes how insights from human brain cognition (e.g., memory, learning mechanisms) can inspire computational models for language tasks. The colored dots in the brain image likely symbolize localized activation patterns, while the network diagram abstracts these into a generalized model. The absence of numerical data suggests the focus is on high-level conceptual relationships rather than empirical validation. The applications listed (dialogue systems, etc.) align with modern NLP goals, implying the model aims to replicate human-like language processing. However, the lack of specificity in the brain data graph limits direct correlation between biological and computational mechanisms.