# Technical Document Extraction: Line Chart Analysis
## Title
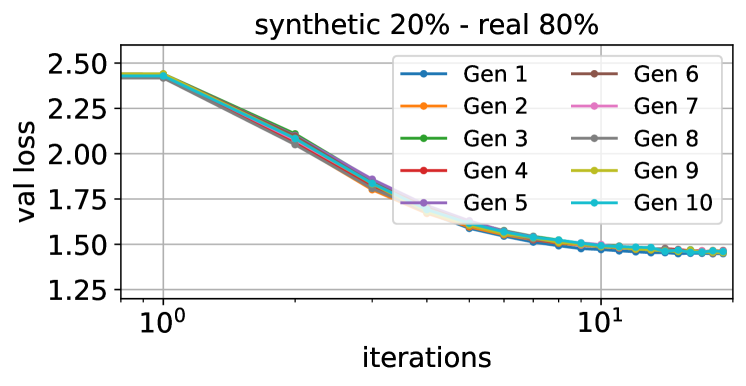
- **Title**: `synthetic 20% - real 80%`
## Axes
- **X-axis**:
- **Label**: `iterations`
- **Scale**: Logarithmic (base 10)
- **Ticks**: `10^0`, `10^1`
- **Y-axis**:
- **Label**: `val loss`
- **Range**: `1.25` to `2.50`
- **Ticks**: `1.25`, `1.50`, `1.75`, `2.00`, `2.25`, `2.50`
## Legend
- **Placement**: Right side of the chart
- **Entries**:
- `Gen 1` (blue line)
- `Gen 2` (orange line)
- `Gen 3` (green line)
- `Gen 4` (red line)
- `Gen 5` (purple line)
- `Gen 6` (brown line)
- `Gen 7` (pink line)
- `Gen 8` (gray line)
- `Gen 9` (yellow line)
- `Gen 10` (cyan line)
## Data Trends
- **General Behavior**:
- All lines exhibit a **monotonic decrease** in `val loss` as `iterations` increase.
- Initial steep decline occurs between `10^0` and `10^1` iterations.
- Lines converge toward lower `val loss` values as iterations approach `10^1`.
- **Specific Observations**:
- **Gen 1** (blue): Starts at `~2.45` val loss, drops sharply to `~1.50` by `10^1`.
- **Gen 2** (orange): Similar trajectory to Gen 1, with a slight plateau near `10^0.5`.
- **Gen 3** (green): Highest initial val loss (`~2.45`), steepest early decline.
- **Gen 4** (red): Moderate decline, intersects Gen 5 (`purple`) near `10^0.7`.
- **Gen 5** (purple): Smooth decline, overlaps Gen 6 (`brown`) at `10^1`.
- **Gen 6** (brown): Gradual decline, flattens near `10^1`.
- **Gen 7** (pink): Steady decline, overlaps Gen 8 (`gray`) at `10^1`.
- **Gen 8** (gray): Slightly higher val loss than Gen 7, converges at `10^1`.
- **Gen 9** (yellow): Highest val loss at `10^0`, sharp drop to `~1.50` by `10^1`.
- **Gen 10** (cyan): Most gradual decline, ends at `~1.45` val loss.
## Spatial Grounding
- **Legend Position**: Right-aligned, outside the plot area.
- **Line Colors**: Confirmed to match legend entries (e.g., Gen 1 = blue, Gen 10 = cyan).
## Component Isolation
1. **Header**: Title centered above the chart.
2. **Main Chart**:
- Logarithmic x-axis with gridlines.
- Y-axis with gridlines and tick marks.
- Overlapping lines representing generations.
3. **Footer**: Legend box with color-coded generation labels.
## Notes
- No non-English text detected.
- All data points and trends are inferred visually; exact numerical values are approximated from the chart's scale.